 | | | 📜 A Note from the Guild Leader |
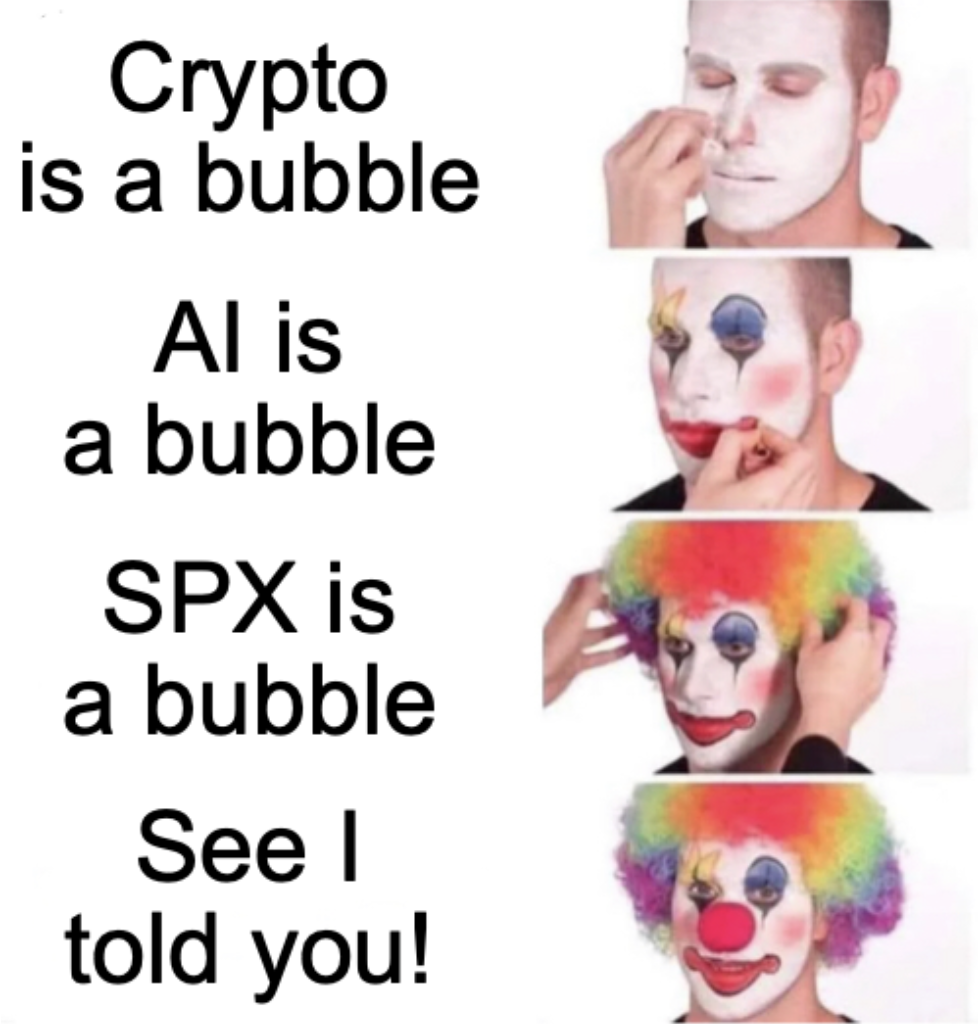
| I have a friend that traded options for 20 years and he trades now in a purely discretionary capacity. He always says things like "Roman, AI is a crazy bubble, I've seen this before", "Just wait until this AI bubble pops", "I wonder if the US will have a debt crisis before this AI bubble pops". He, along with all of these folks on LinkedIn posting about an impending doomsday, always give me a chuckle. This letter is dedicated to him (don't worry he knows, hey Jay!). | | | There is a quantitative problem with shouting doomsday: you never have to answer the phone. These folks aren't getting squeezed out of their shorts, and they're usually still triple long even with these strong opinions. I dislike the act of rocking the boat for the sake of it, or to try and look like Michael Burry to those that haven't seen the distribution of WWII fighter plane damage. Reversion in this context will always be an artifact of a negative catalyst which is never known a priori. It's much like Cramer's Mad Money, he never actually has to answer for his picks that are wrong, but he can always cite his picks that were correct. No shade to Cramer at all, I love what he does, but I would enjoy more transparency for the casual viewer that doesn't understand qualitative survivorship bias. That being said, this is your weekly reminder to master your quantitative skills so you can make your own informed decisions in the face of uncertainty to not be fooled by the casual (and typically baseless) qualitative statement! | With that I will leave you to the Weekly Guild Letter. I hope you enjoy, and I hope you learn something! - Roman | | | 🧮 Quant Model of the Week |
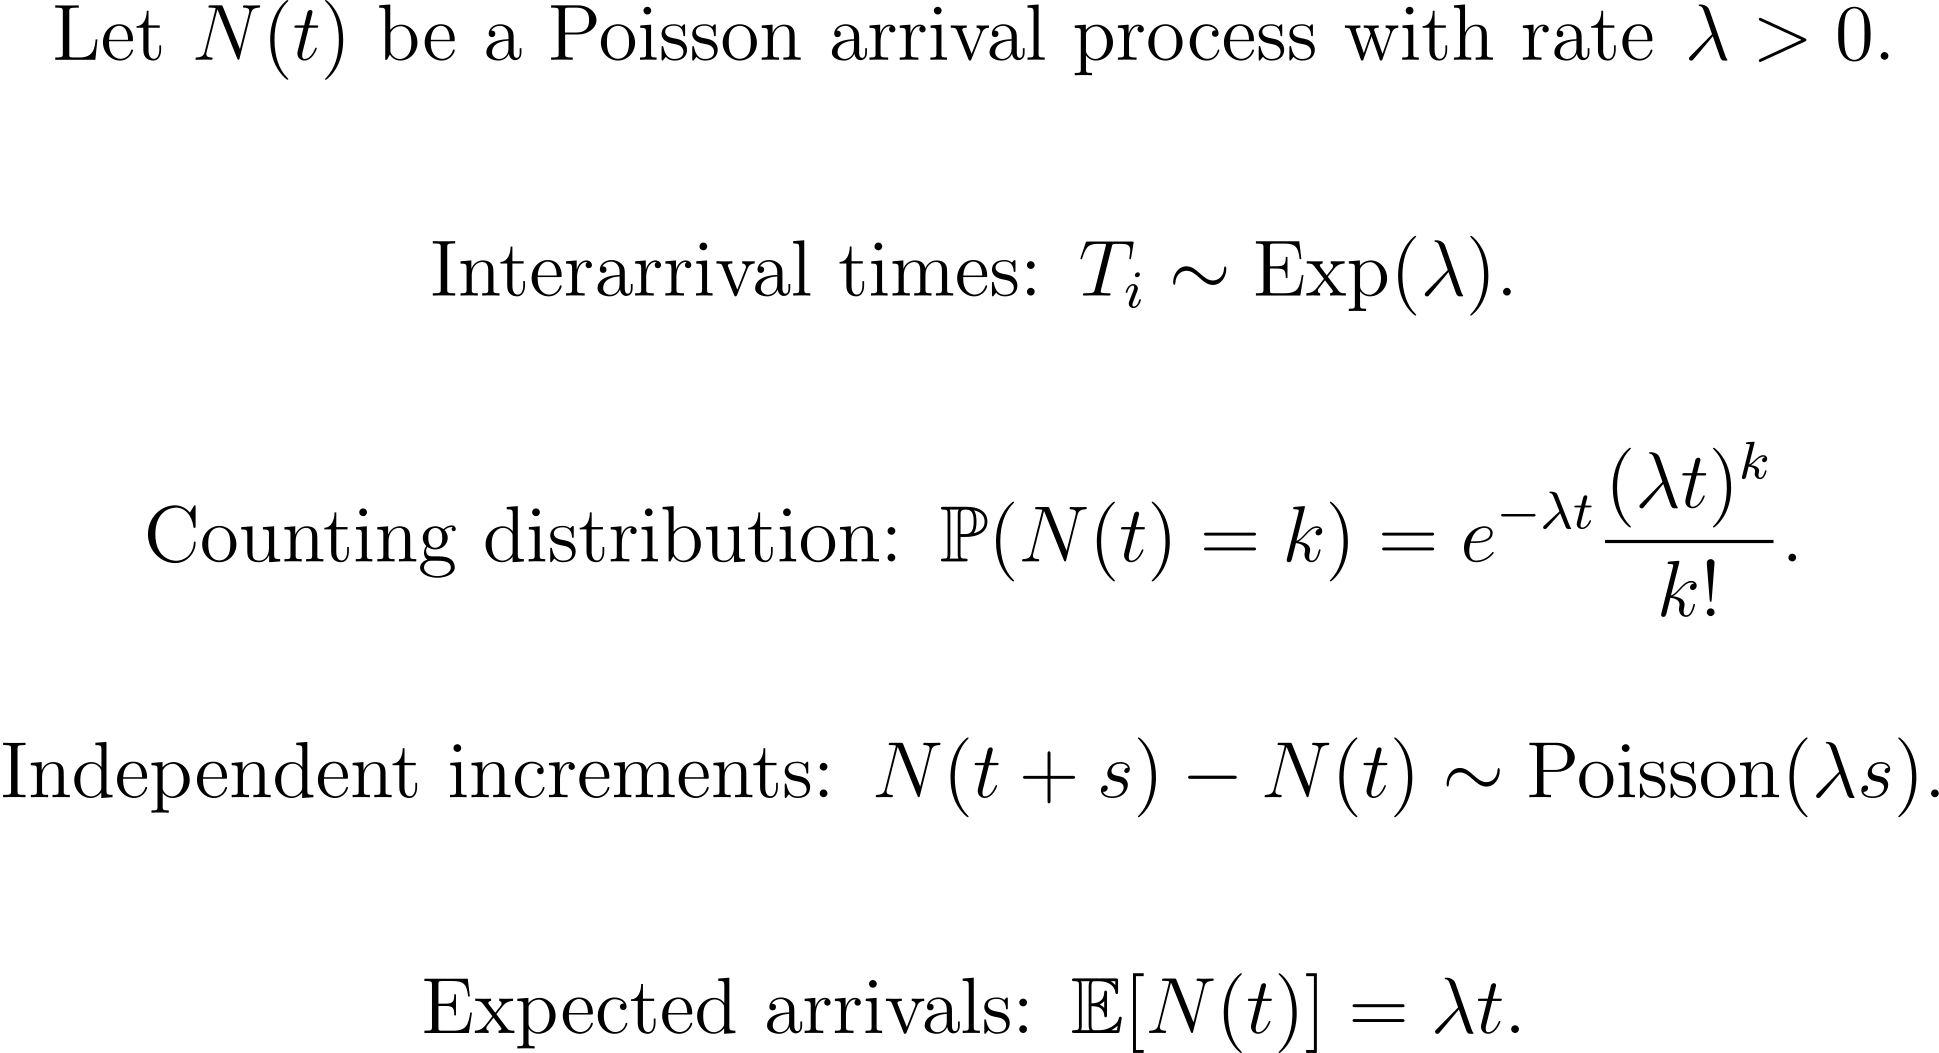
| | | Some things in markets don’t evolve smoothly at all: they arrive. A trade hits the tape. A news headline drops. A quote updates. A block order sweeps the book. A jump fires off in a price series. All of these are “events,” and the markets are basically a never-ending stream of them. Once you start looking at financial data through that lens, you realize how much of what we care about is really an arrival process. Trades arrive. Orders arrive. Information arrives. Volatility shocks arrive. Even liquidity itself, it shows up in bursts, disappears, then shows up again. The simplest way to model this flow of events is the Poisson Arrival Process. Here’s what the model looks like: | | | You pick an intensity (lambda, perhaps estimated from historical data), the average rate at which events occur, and the process takes care of the randomness. Sometimes events cluster, sometimes there's a lull, but the idea is the same: the world doesn’t update every millisecond; it updates whenever something happens. 📈 Model applications The Poisson arrival process is the cleanest way to model “things that show up whenever they feel like it.” Its waiting times follow an exponential distribution, which is memoryless, meaning the process doesn’t care how long it’s been since the last event, the probability of the next one arriving is exactly the same. Add independent increments, and you get a structure where arrivals in disjoint intervals never influence each other. It’s simple, almost too simple, but that’s why it works: information hits, trades print, jumps occur, orders queue and clear, each arrival starts fresh. The Poisson process is the backbone behind the intuition that markets have “their own clock,” and that risk often comes not from where you are on the calendar, but from the next arrival you don’t see coming. You see Poisson processes all over quant finance once you know where to look. Merton’s jump-diffusion uses a Poisson clock to trigger discontinuities in price. Hawkes processes enrich that idea by letting arrivals spark more arrivals, capturing clustering in order flow and volatility. Credit risk models use Poisson-style intensities to represent default events. Market microstructure research uses them to describe trade arrivals, order submissions, and cancellations. Even limit-order-book models lean on Poisson arrivals to approximate how liquidity comes and goes. In every case, the Poisson component is doing the same job: giving randomness a schedule, giving shocks a mechanism, turning “stuff happens” into something you can simulate, price, and manage. 🎓 A little story This isn’t a story but a remark from me (Roman, 👋 hi!) about the unreasonable effectiveness of the memoryless property. We see this in the real world all the time. Of course there’s dependency everywhere, but independence can be a surprisingly clean way to represent that dependence in some cases: you’re sitting outside and for ten minutes nothing happens and then BOOM three cars fly by. Markets behave the same way. No trading for ages, then suddenly size hits the tape and everything lights up. The exponential waiting time doesn’t capture the full richness of that behavior, but it captures the feeling of it: every arrival is a fresh start. When I first learned about arrival processes, I expected something far more complicated. Markets are messy, order flow has structure, information is clustered… why start with something as naive as a memoryless process? But then the intuition landed: sometimes the simplicity reveals the structure. A Poisson process doesn’t try to model every microdependency; it says, “Look, events come when they come, and if that’s what matters for your model, start here.” And the surprising part is how often that works. Modeling trade arrivals, jump times, quote updates, order cancellations, information releases, so many “events” in quant finance behave well enough under a Poisson clock that the mathematics becomes tractable without losing the spirit of the phenomenon. Good models aren’t the ones that cram in every detail; they’re the ones that capture the right mechanics with the least machinery. The Poisson process is exactly that kind of model. It doesn’t predict when the next event happens, it gives you the right way to think about the uncertainty of when it happens. 💡 Takeaway In practice, nothing in markets is perfectly Poisson, but plenty of things behave Poisson-ish when viewed through the right lens: order arrivals, trade prints, news bursts, jump times, liquidity shocks. Each model that uses a Poisson clock, whether it’s Merton’s jump diffusion, Hawkes-style contagion models, or market microstructure arrival models, is really asking the same question: how does risk enter the system, and how often? Of course, no arrival model is complete, and we’ve only scratched the surface of point processes. But without the Poisson framework, we’d have no tractable way to talk about timing risk. With it, we get a clean, powerful structure for turning unpredictable events into something measurable, one arrival at a time. | | | 🏆 Quant Question of the Week |
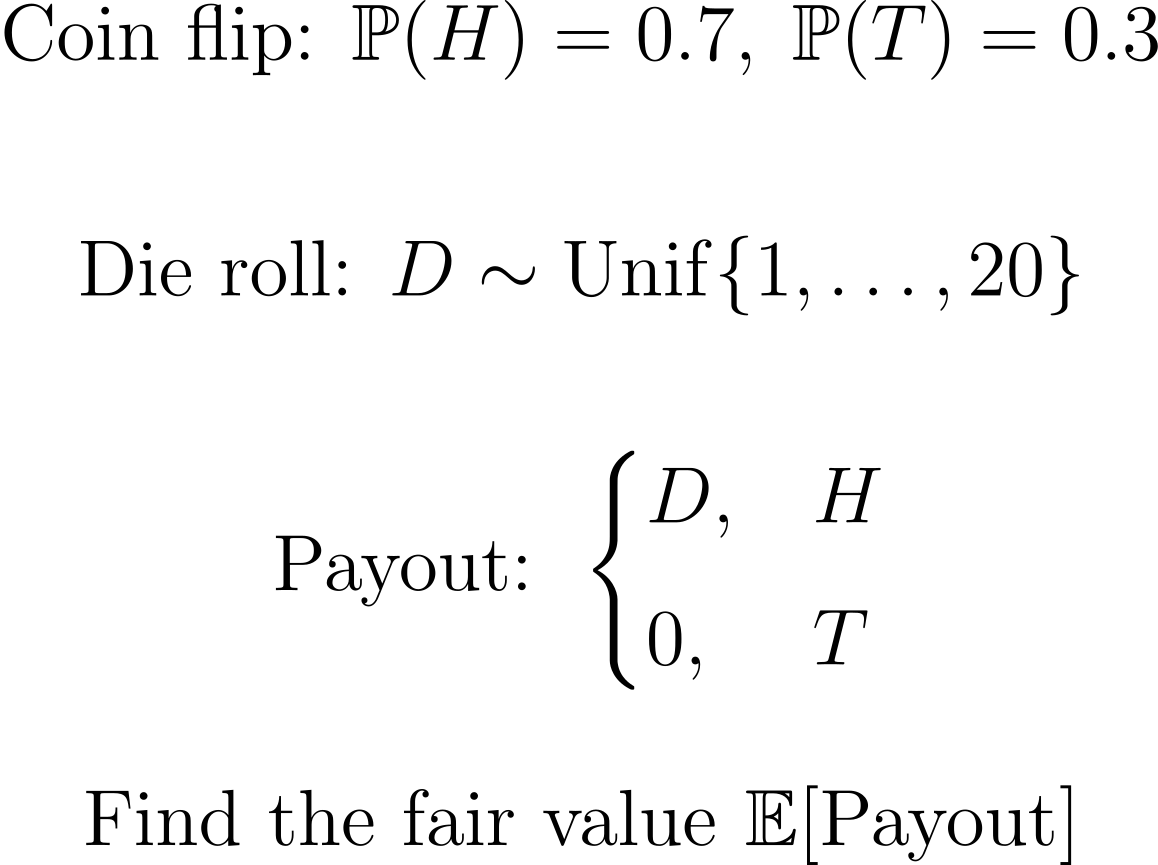
| Solution at the Bottom of this Email 👇 |
| | | Need to study up on topics in math, probability, and finance? 👉 Learn to solve problems like this on Quant Guild — the platform I wish I had when I was studying to become a quant. | | | 📅 Quant Guild Week in Review |
| Why Your Backtests are Wrong and Markov Regime Build Pt 1 |
|
|
|
|---|
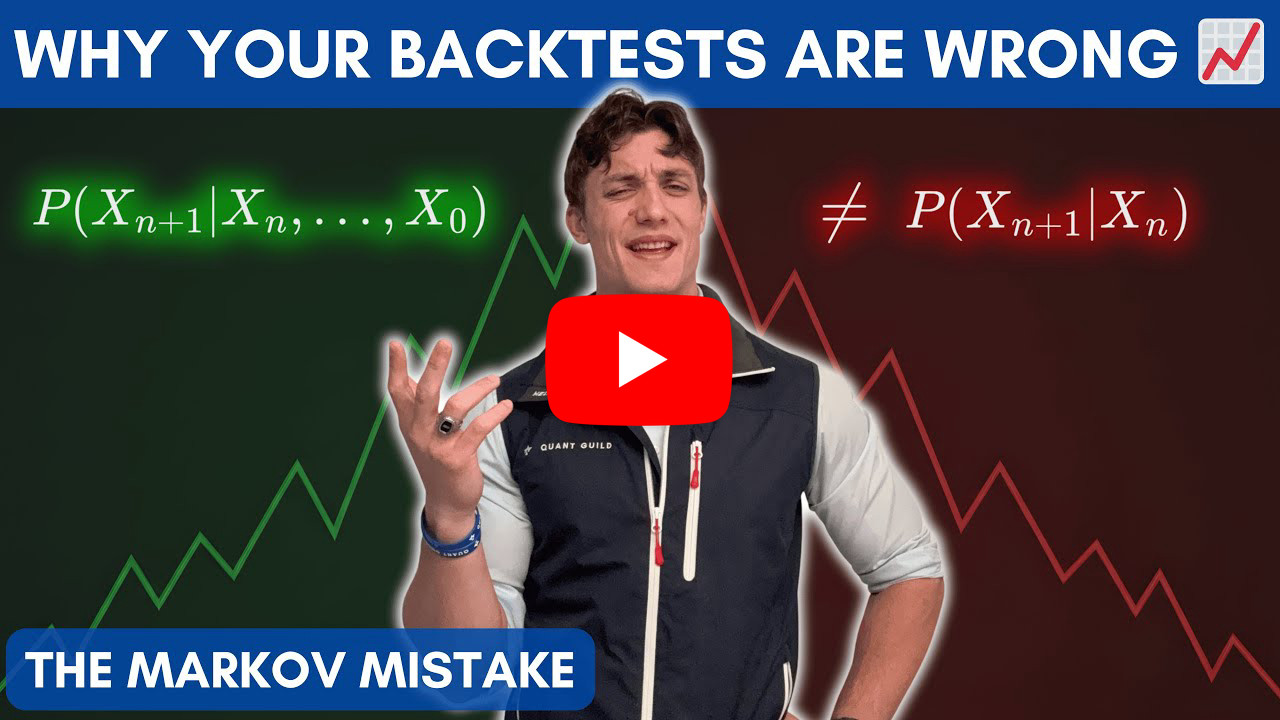
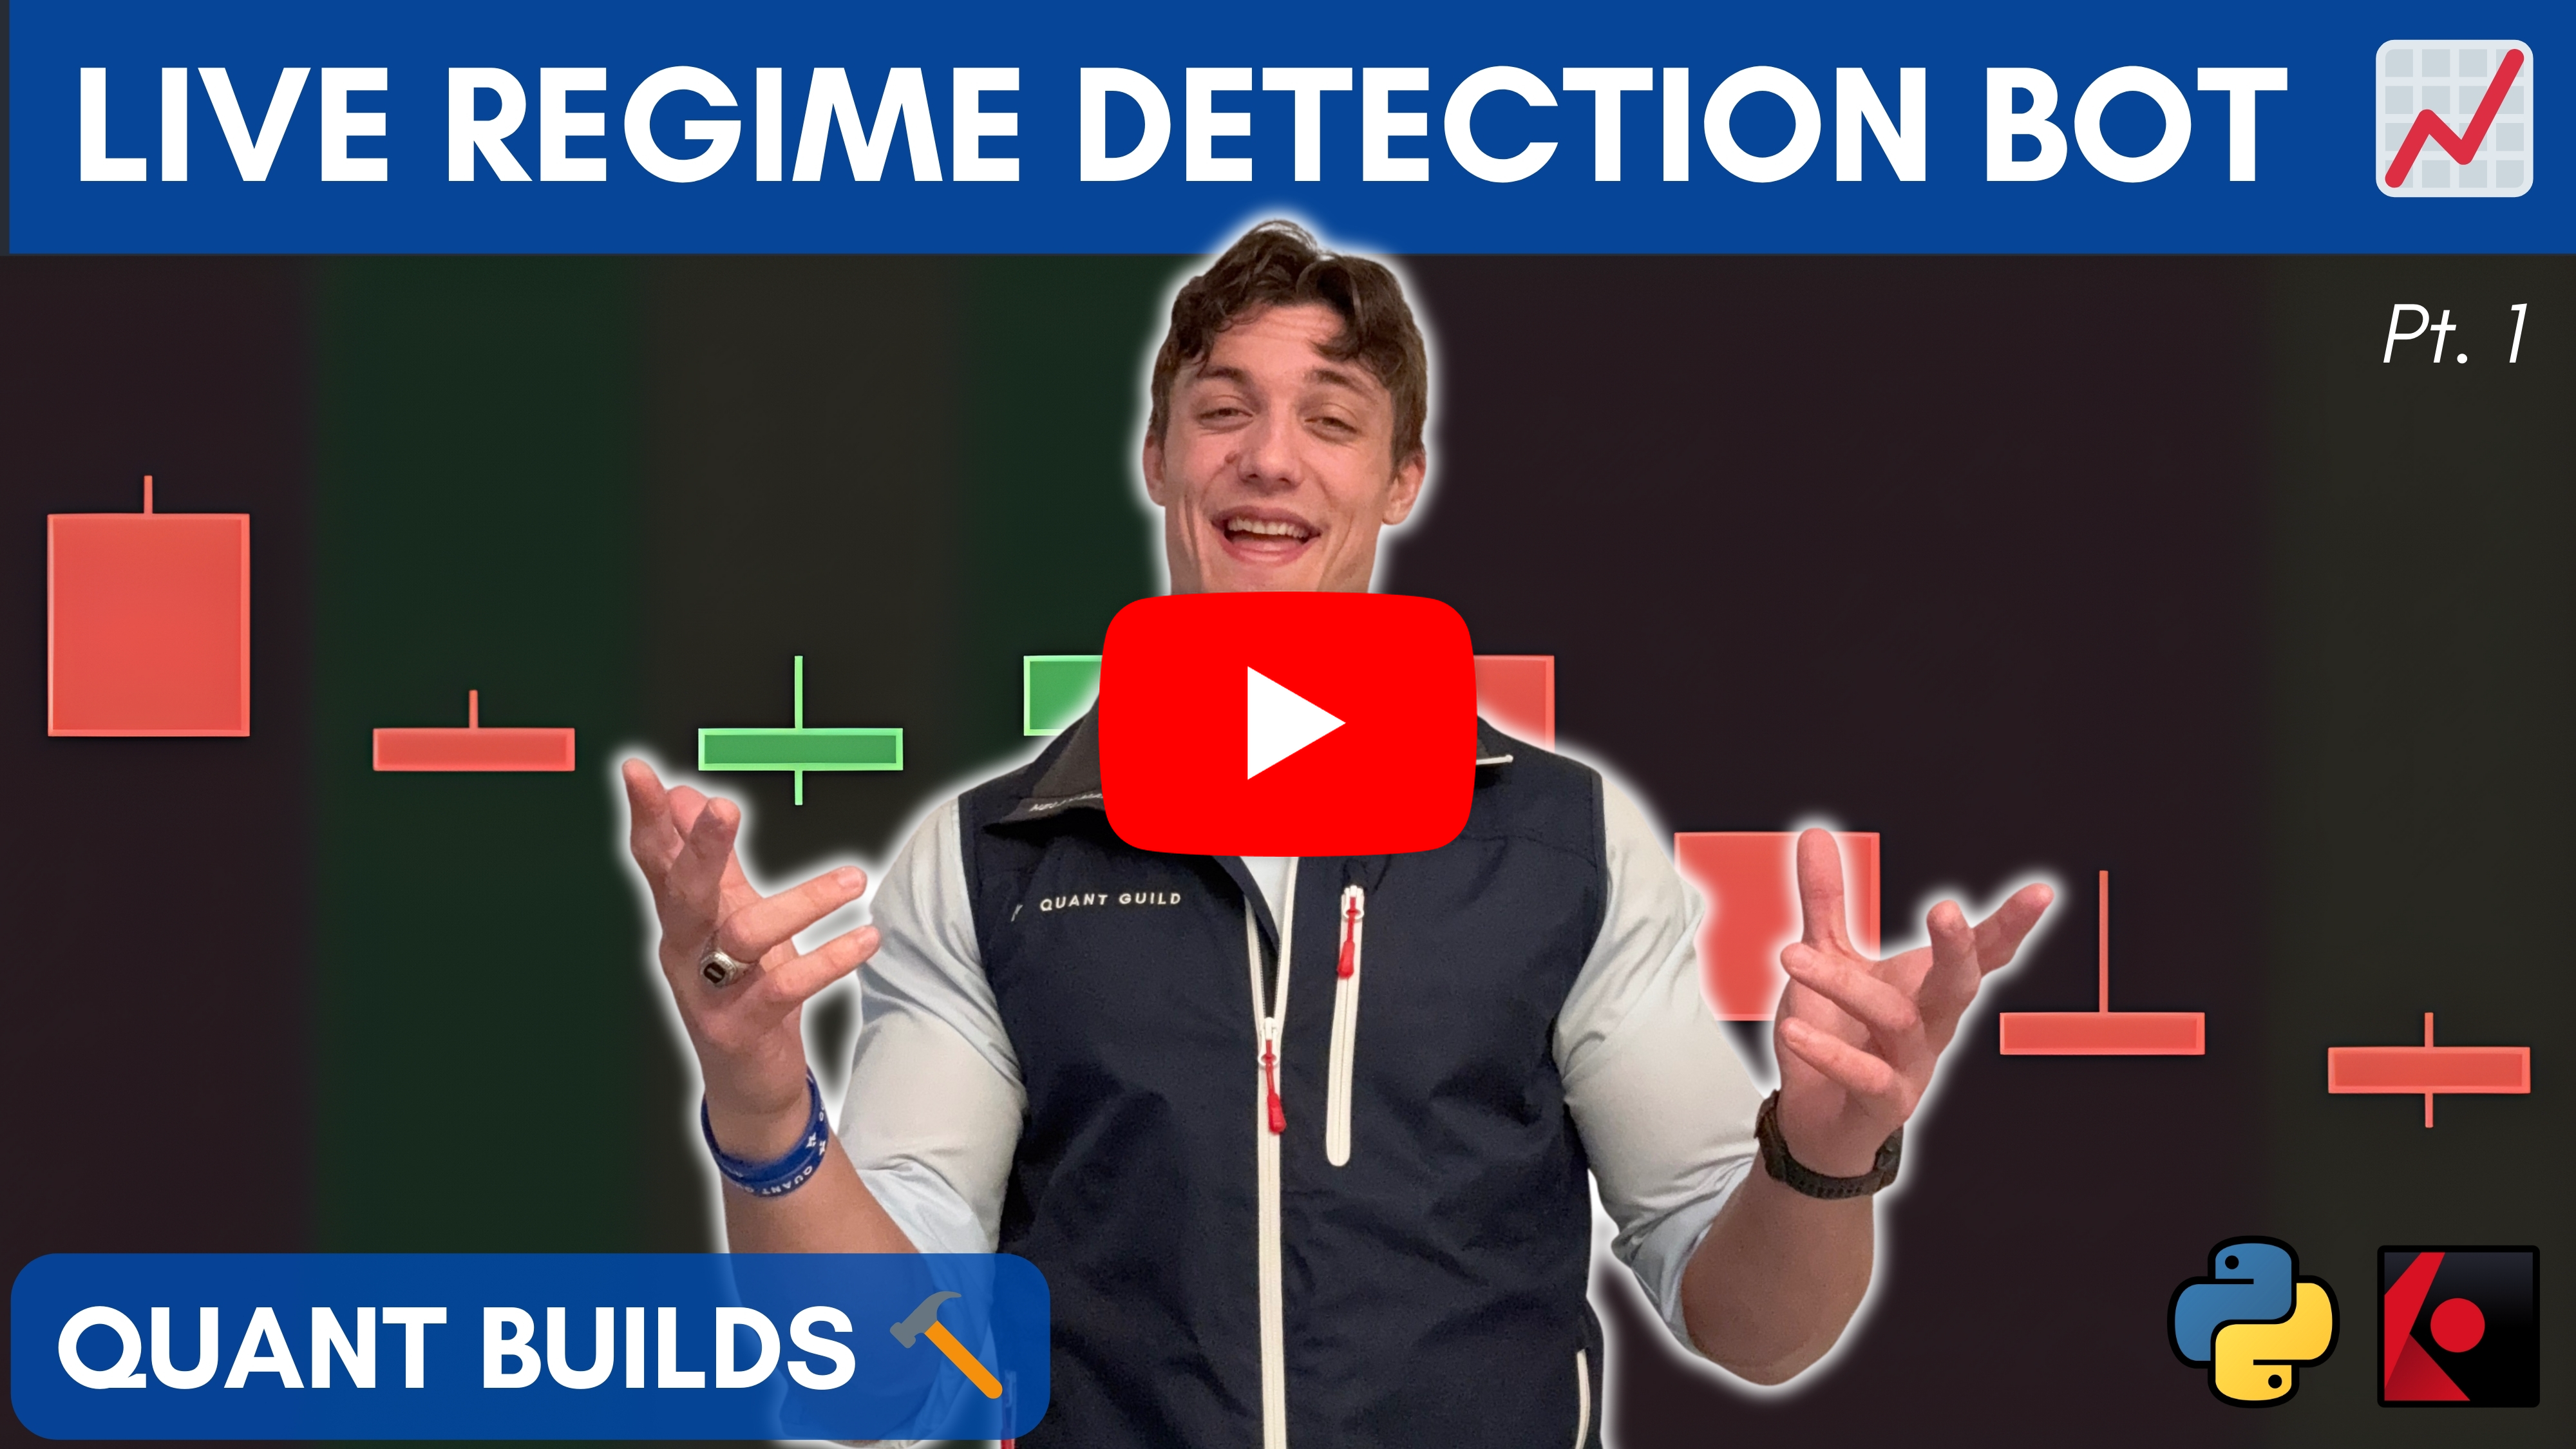
📈 Why Your Backtests are Wrong | Markov Property | In this video I explain why most people’s backtests are fundamentally incorrect. The core issue is a misunderstanding of unconditional versus conditional statistics. I start with simple two-dice examples to show how distributions, probabilities, and theoretical means completely change once you condition on new information. The law of large numbers guarantees unconditional convergence, but the moment you reveal any piece of state information, everything shifts. That distinction becomes critical when we move from dice to markets. From there, I introduce the Markov property. In a true Markovian system the distribution of the future depends only on the current state, not the full path that led there. That is a huge simplification. But markets are not Markovian. The conditional distribution given the full history is not equivalent to the conditional distribution given the current price alone. And once you see that, the central failure in most backtests becomes obvious. When traders look at every entry signal in a strategy and then throw all of the resulting PNLs into one distribution, they are mixing entirely different conditional distributions as if they came from the same underlying generating process. They do not. Two identical signals occurring at different points in the price path will not share the same theoretical PNL distribution. Treating them as one leads to incorrect expectancy estimates, misleading diagnostics, and bad trading decisions. I show visually how conditioning on different parts of the path produces different PNL distributions, and how ignoring this path dependence causes people to reject strategies that actually have positive expectancy in the correct regimes. I then walk through how to fix this problem: compress the state space into meaningful variables like volatility regimes or momentum regimes, expand the state representation when necessary, or build more sophisticated non-Markovian models that capture the true path dynamics. The big takeaway is simple. If you mix conditional distributions without accounting for path dependence, your empirical results will never converge to anything meaningful. To backtest correctly, you must respect the conditional structure of the market and model the right state variables. This is the only way to approximate the true distributions your strategy will face in live trading. Here's a link to the full video 👇 | | | 🎲 How to Build a Live Regime Detection Bot | Pt 1 | In my last video, I explained why most backtests are wrong. If you ignore the path-dependent nature of markets and fail to account for latent processes and regime dynamics, then every statistic inside your trading system is misleading. In this video, I turn that idea into something actionable that you can drop directly into your own workflow. This is part one of a two-part series where I show you, step by step, how to build a live Markov chain regime detection bot in Python. We use Interactive Brokers’ Python API to stream real-time tick data, aggregate it into five-second bars, and build the full application architecture from scratch. No AI, no scaffolding, I narrate every line of code so you understand exactly how the system works under the hood. In this first installment, we focus on building the entire user interface and all server interactions needed to run a live regime detection engine. In part two, we’ll implement the actual Markov chain model and integrate it into the application. And if you need a refresher on Markov chains or hidden Markov models, I already have full videos on both that pair perfectly with this build. Here's a link to the full video 👇 | | |
|
|
|---|
|
 | 📈 Why 10,000+ Quants Study on Quant Guild | Quant Guild is the one-stop platform for mastering the math that powers modern finance. With 90+ specialized lessons, adaptive practice with gamified progress that scales with your skill level, real interview questions, courses from A - Z in coding, math, probability & statistics, and exclusive live classes with me, it’s built to take you from fundamentals to the front-office. Everything’s designed for how real quants think and work — focused, practical, and deeply technical. That’s why over 10,000+ students and professionals study on Quant Guild to sharpen their edge and make smarter decisions in the face of uncertainty. |  |
|
|
|---|
| | I'm in QR preparing for technical interviews and your practice helped me brush up on probability, thanks | | |
| | |
|
| | | I learned more here in two days than an entire semester of college | | |
| - Guy on Discord Who DM'd Me |
|
|
|
|---|
|
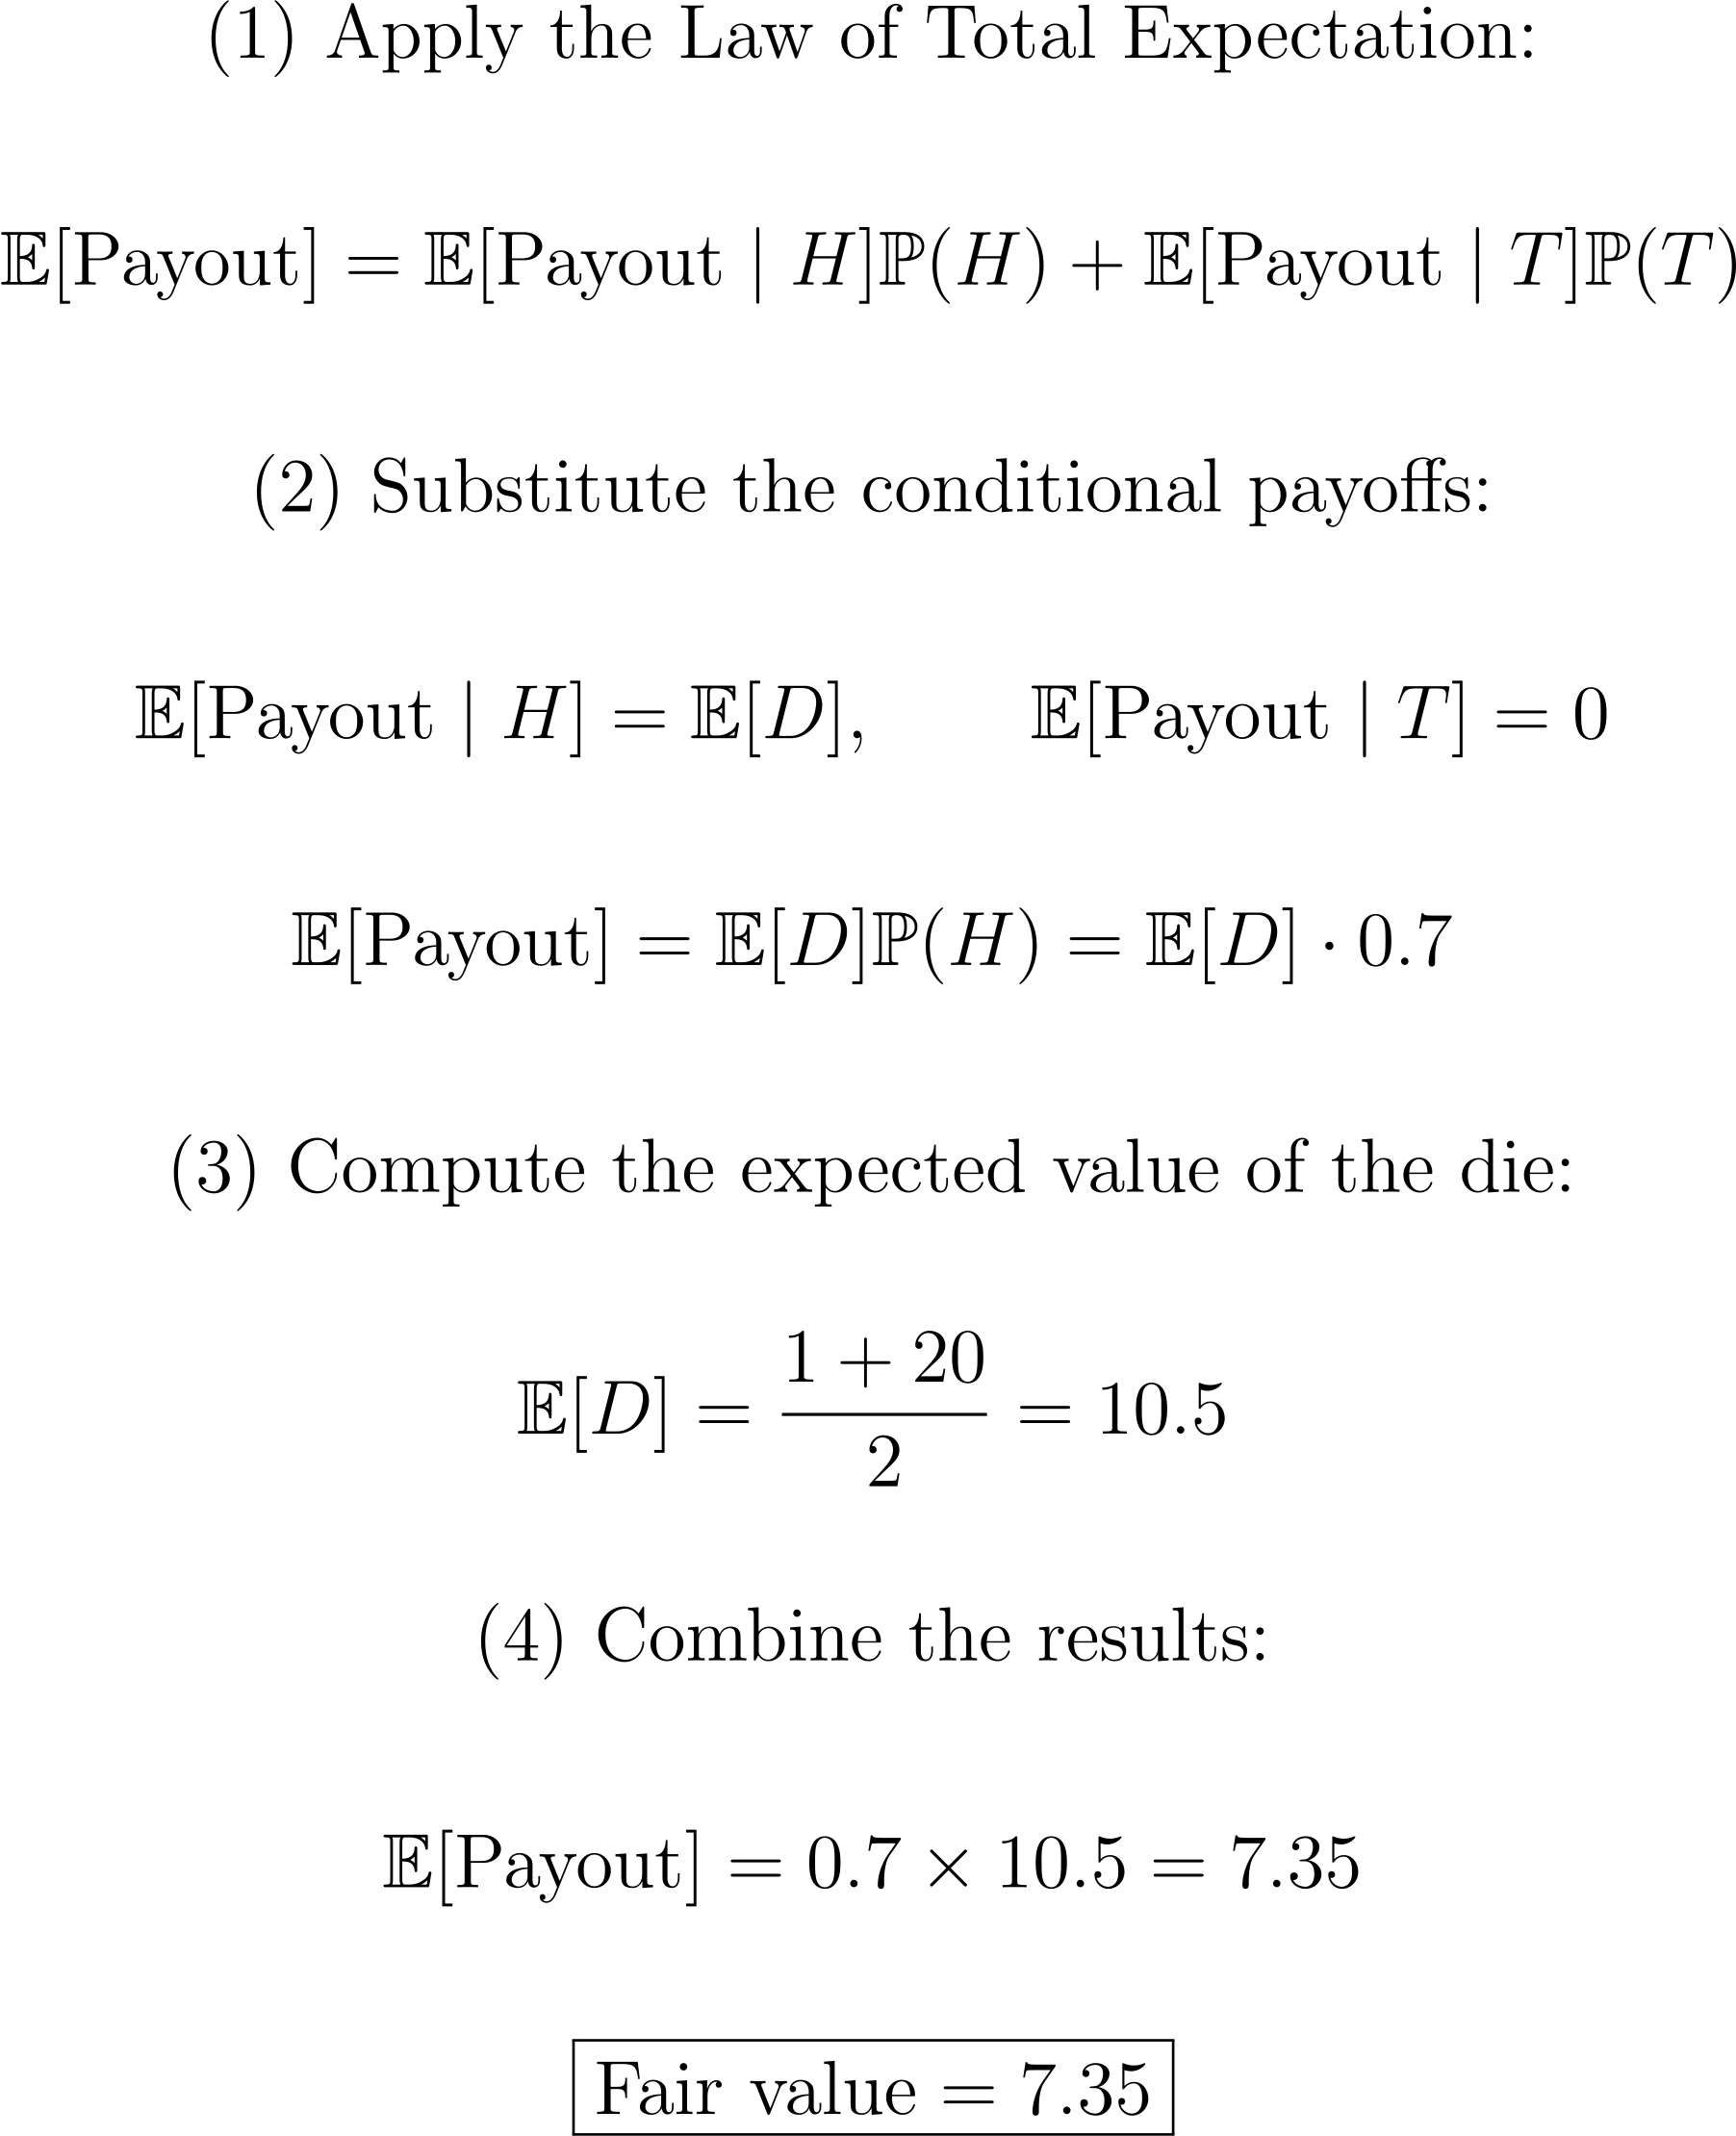
| | ✅ Quant Question of the Week |
| | | | | | |
|
|
|---|
|

 Roman Paolucci