 | | | 📜 A Note from the Guild Leader |
| 🚀 I am once again, so beyond stoked to announce a massive update to Quant Guild! | 📊 A New Quant Course: Quant Stats (40h+ of Content) Introducing the latest Quant Course: Quant Stats. This course focuses on the study of probability and statistics from the ground up while formally discussing the connection between material "in the classroom" and the reality of modeling in practice; something many university and more formal academic classes miss. I've taken everything I've learned over the years from academia and what I've seen actually work in practice and created this course to bridge the gap between the two. This isn't just content you would find in a college course on probability and statistical theory, but includes real discussions, assignments, and projects about deviations in practice and how to think about and handle them. Quant Stats is the latest member course to release; with Quant Math in the queue to release next - it continues to be a great investment to be a Quant Guild Member as hundreds of hours of content continues to remain in development for future release! |  | 💎 Masterclasses (20-60h+ of Content) By popular request, I have put together lectures from previous live sessions into Masterclasses available now on Quant Guild. These classes require a strong working knowledge of math, probability, and finance. It is highly recommended to study the relevant Quant Courses if you are unfamiliar with any of these topics before considering a seat in one of these classes. Current offerings include Financial Mathematics and Quantitative Trading. Financial Mathematics covers essential mathematics and statistics for market-making and trading roles. Quantitative Trading covers the quantitative research pipeline for cross-sectional equity trading strategy design and development. Masterclasses will continue to be released and updated as new live sessions run and previous course materials are updated. |  | 🏛️ A Note on Student Success Over the past few months I've had the rewarding experience to connect with members mastering their quantitative skills on Quant Guild. These members range from independent researchers learning the necessary skills to build their own projects to students and professionals preparing for technical interviews. The results have been outstanding, and I am so beyond proud of their work ethic, appreciative of their feedback, and impressed by their passion for studying technical topics. Quant Guild members and live course alumni have received trading and market-making roles at firms including Wells Fargo, Barclays, JPM, and more with the range of self-reported compensation between $150k - $350k. These members leveraging Quant Guild to land highly specialized roles found a variety of features helpful for their prep including the adaptive practice engine, quant courses to brush up on old topics and fill knowledge gaps, and masterclasses/live classes to help formalize their understanding of the applications of academic topics in industry. Most recently, a Quant Guild alumnus, Pol, landed a Market-Making role in London and offered to share his experience with Quant Guild in a short video (thank you, Pol!). You can find his video testimonial below and on Quant Guild. | 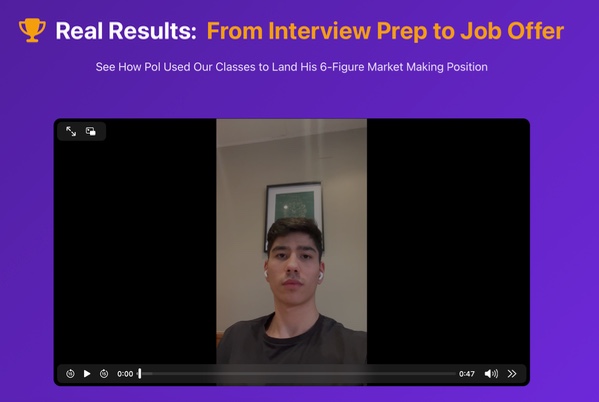 | 📚 A New Live Class Session: Computational Finance I’m excited to announce a new live class, Computational Finance. This course is designed to bridge the gap between academic theory and industrial practice. Assignments and projects are intended to build and refine the necessary skills for students to be effective contributors in both an academic or industrial setting. This live class session will run for five weeks beginning March 2nd, ending on April 1st. Enrollment will be open to a maximum of 10 students, and class will be held twice a week on Monday and Wednesday for 1h15m. If you’re looking to enhance your quantitative toolkit, check out this live class session covering mathematics, probability and statistics, machine learning, and the various industrial applications on Quant Guild. | | | ⭐️ Quant Guild Membership (200h+ of Content) Between the Quant Courses, Adaptive Practice Engine, Lessons, Interview Questions, and Trading Games, Quant Guild members have hundreds of hours of material available to them to study and practice as they continue their journey mastering their quantitative skills. As with every release, and to offer the highest quality of support to my members and students possible, prices have increased to reflect the available content. Members are always grandfathered into their old rates indefinitely until cancelled. | 📜 A Special Note from the Guild Leader I want to express a sincere thank you to all of my Quant Guild Members, subscribers on YouTube, and followers of my technical education content in general: thank you. Without you, none of this would be possible. I will continue to work tirelessly to make Quant Guild the highest quality and most abundant source of technical knowledge available packaging university education and industrial knowledge for 90%+ off university and industrial education prices. | With that I will leave you to the Weekly Guild Letter. I hope you enjoy, and I hope you learn something! - Roman | | | 🧮 Quant Model of the Week |
| Moving Average Model - MA(q) |
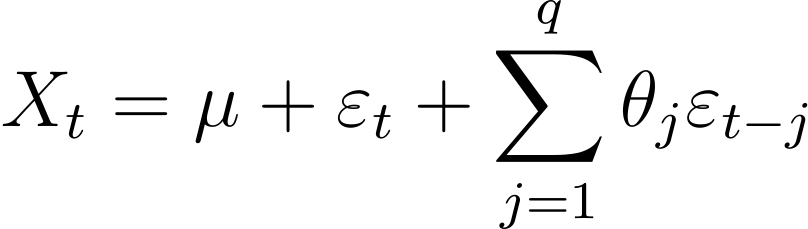
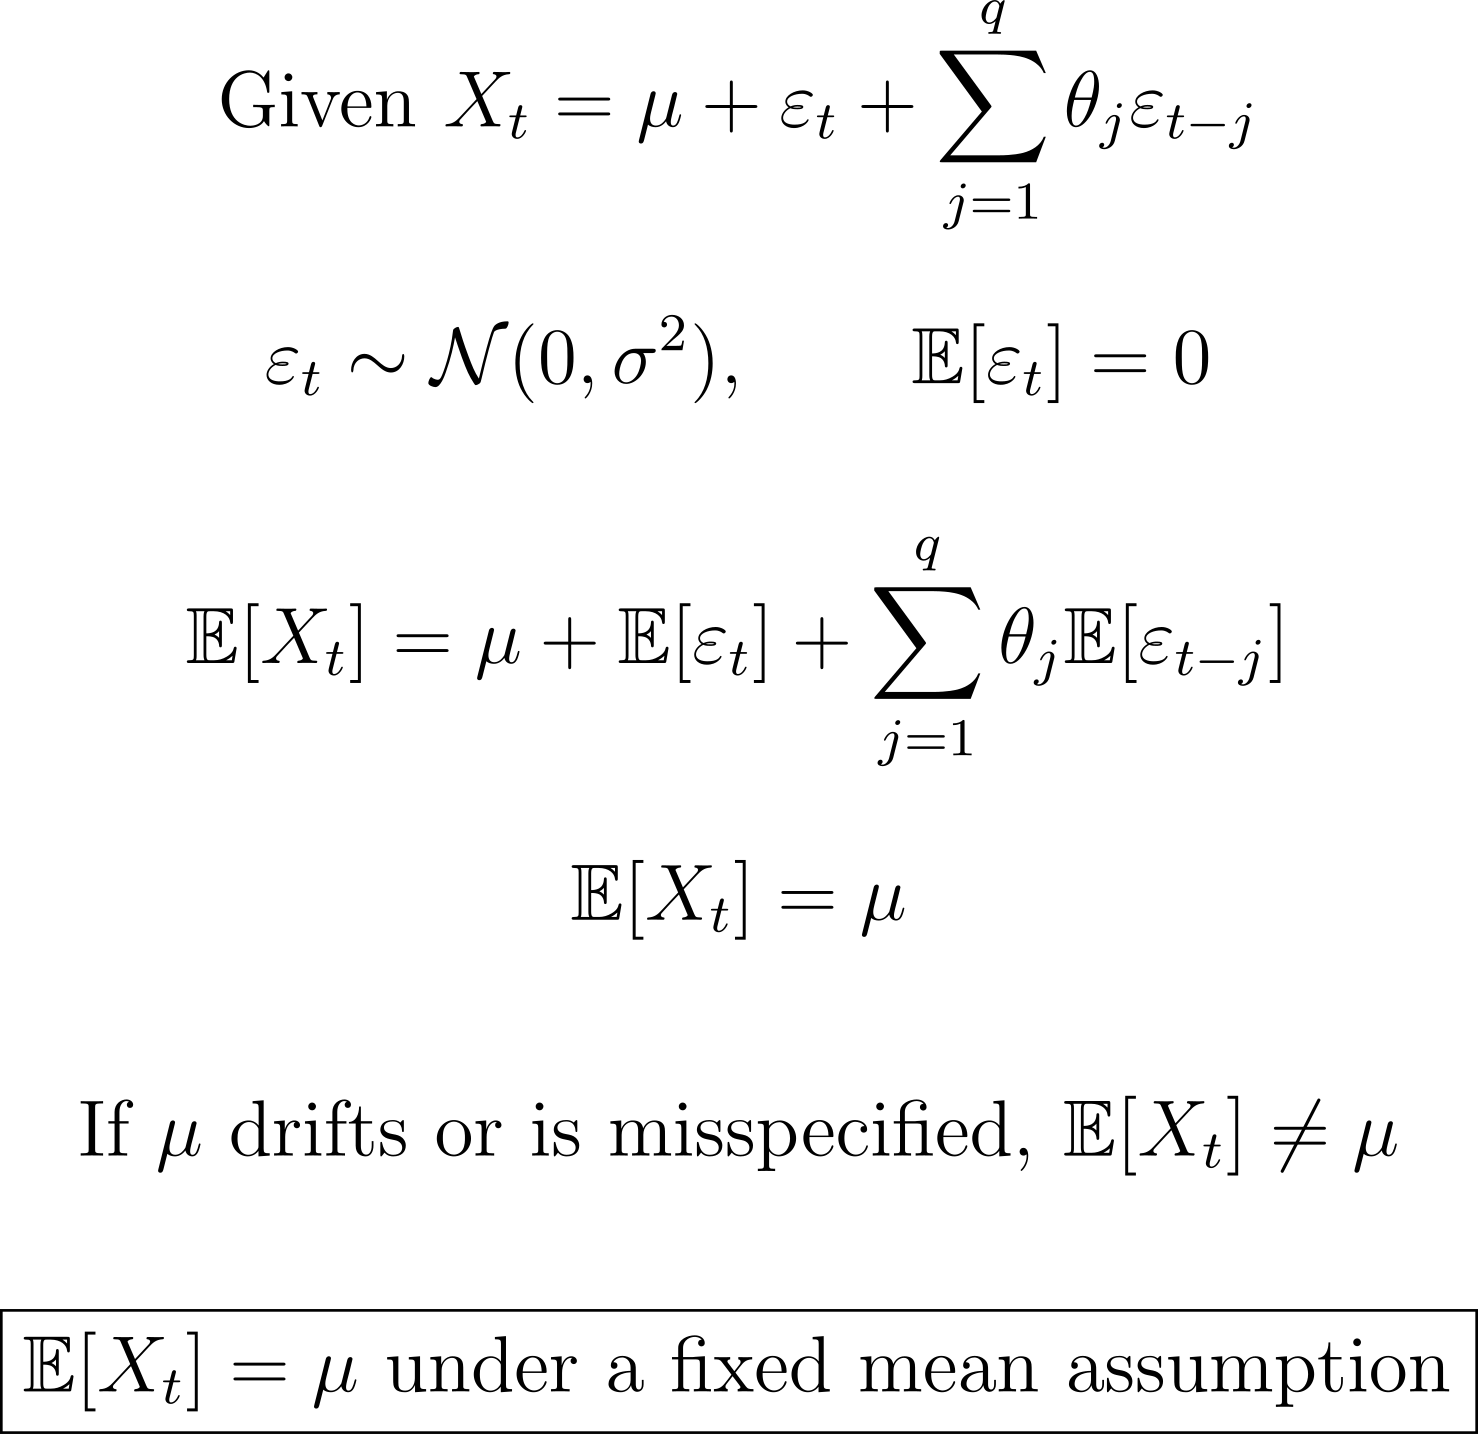
| Markets don’t just react once and move on. News hits, liquidity shifts, a trade goes through, and the impact lingers. Sometimes it fades quickly, sometimes it ripples for a few periods, sometimes it shows up in strange places downstream. The idea that randomness arrives, does its damage, and immediately disappears just doesn’t survive contact with real data. Moving average (MA) processes offer a simple way to model that behavior. Instead of letting past values drive the present, an MA model lets past shocks do the talking. Today’s value is built from today’s noise plus a weighted history of recent surprises. A shock doesn’t echo forever, but it doesn’t vanish instantly either, it gets absorbed over time, leaving a temporary footprint before the system settles back down. This is a subtle shift, but an important one. AR models describe how levels persist; MA models describe how errors propagate. Together they explain why markets can look jumpy without trending, volatile without drifting, noisy without exploding. In an MA world, what matters isn’t where you were, it’s what just happened, and how long the market takes to digest it. Here’s what the MA structure looks like: | | | A moving average, MA(q), model says that the value of a process at time t is built not from its past values, but from its past surprises. Each coefficient controls how strongly a recent shock continues to influence the present, while the baseline level reflects where the series would sit once those effects have washed out. The “new” information is still the current shock, but unlike in an AR(p) model, its influence is temporary. it gets absorbed and then disappears after a fixed number of periods. Depending on the size and structure of the coefficients, shocks can die out quickly or linger just long enough to create short-term momentum without long-term drift. In one line, the model captures a different truth about time series: markets remember what just happened, not forever, but longer than people expect. And yes, this is exactly the kind of structure that ends up hard-coded into technical indicators, often used blindly as “signals,” even though underneath they’re just assumptions about how long markets take to digest noise. Technicals can work, just like anything else: models can work, stop working, then begin working again; the difficult part is figuring out and explaining why so you can continue to make money. | 📈 Model applications Moving average processes are often the other half of the first toolkit quants reach for when working with time-series data. They’re simple, interpretable, and capture a different but equally important idea: markets don’t just move because of persistent levels, they move because of shocks, and those shocks don’t get absorbed instantly. An MA model says “today depends on recent surprises,” and that alone explains a surprising amount of short-term behavior. You can model how news impact decays, how microstructure noise bleeds into prices, or how sudden dislocations reverberate for a few periods before fading out. What MA models do especially well is separate noise from structure. A shock arrives, it disturbs the system, and then its influence dissipates according to a fixed pattern. There’s no long memory, no drifting baseline, just a controlled digestion of randomness. That’s why MA components show up everywhere signals look reactive but not persistent: jumpy prices without trends, volatility bursts without regime shifts, indicators that flare up and then quietly return to baseline. But just like AR models, the real value of MA processes isn’t that they’re “right,” it’s that they make their assumptions explicit. They assume shocks matter, but only temporarily. They assume the system eventually forgets. And when those assumptions stop holding, when shocks cluster, when volatility feeds on itself, when regimes change, the model breaks in visible ways. That’s not a failure; it’s information. It tells you the market is doing something your structure can no longer explain. MA processes also sit quietly underneath more sophisticated models. Combine them with AR terms and you get ARMA and ARIMA, the workhorses of classical forecasting. Pair them with conditional volatility and you’re on the road to ARCH-style dynamics. Extend them across assets and you start modeling how shocks propagate through systems rather than individual series. In that sense, MA models aren’t endpoints, they’re components. And, as always, the same lesson applies: time series are reflections of real behavior. Markets absorb shocks at different speeds depending on liquidity, participation, and regime. An MA model works as long as the way markets digest information stays roughly the same. When that digestion changes, the model stops fitting, and that’s usually your signal that the world has shifted, not that the math has failed. 🎓 A little story Like everyone else, when I first got into quantitative finance and trading, I tried to build a moving-average crossover bot. This was well over fifteen years ago. I didn’t know what a non-Markovian process was, had no intuition for regimes, and couldn’t tell you the difference between conditional and unconditional distributions. I just wanted an "indicator" to "work". Two lines on a chart, one crossing the other, buy here, sell there, surely that had to be enough (shocker, it's not). But that early trial-and-error phase wasn’t a failure; it was the beginning. That simple curiosity, “why doesn’t this consistently work?”, quietly set up more than a decade of studying financial mathematics, statistics, and actual trading. The path from trivial indicators to serious models isn’t a bug in the process, it’s a feature. Everyone starts there. Some people stop and others just keep going. It's not just about trading, or even trial and error, it's about learning. We don’t build MA or AR models because we believe markets are stable. We build them to understand how instability expresses itself. We don’t rely on a single indicator or equation to predict outcomes; we use simple models alongside volatility dynamics, regime awareness, structural context, and stress thinking to assess likelihoods. Modeling isn’t about certainty. It’s about preparation. Once I understood that, moving averages stopped feeling like naïve toys and started feeling like what they really are: lenses. Imperfect on their own, but useful when you know what they’re showing you, and just as importantly, what they’re not. Markets evolve. Regimes shift. Models break. And learning how and why they break is often more valuable than finding one that “works.” 💡 Takeaway If our models don’t take shock propagation seriously, we end up building time-series frameworks that miss how markets actually react to information. Markets aren’t just about levels drifting through time; they’re about surprises hitting the system and being absorbed, distorted, or amplified before they fade. Moving average processes are the wiring behind that behavior. Ignore how shocks echo forward, and your signals, forecasts, and risk estimates become detached from how markets really digest events. Most practical time-series models aren’t built from scratch, they’re “MA(q) plus structure.” Combine MA with AR terms and you get ARMA and ARIMA. Add conditional volatility and you start capturing how shocks cluster and bleed into risk. Add state dependence and you model how the market’s response to news changes across regimes. An MA model on its own isn’t the full story, but it’s a crucial piece of the machinery. So no, markets don’t follow clean, finite-memory MA processes any more than they follow perfectly stationary AR ones. But MA structure still gives us something essential: a disciplined way to think about how information and noise work their way through time. Improve that structure, allow shocks to last longer, interact with volatility, or change across regimes, and everything downstream improves with it: signal timing, risk attribution, scenario analysis. Moving averages aren’t just indicators on a chart. They’re assumptions about how markets process shocks. And the closer those assumptions line up with reality, messy, regime-dependent, and imperfect, the more useful and honest our models become. | | | 🏆 Quant Question of the Week |
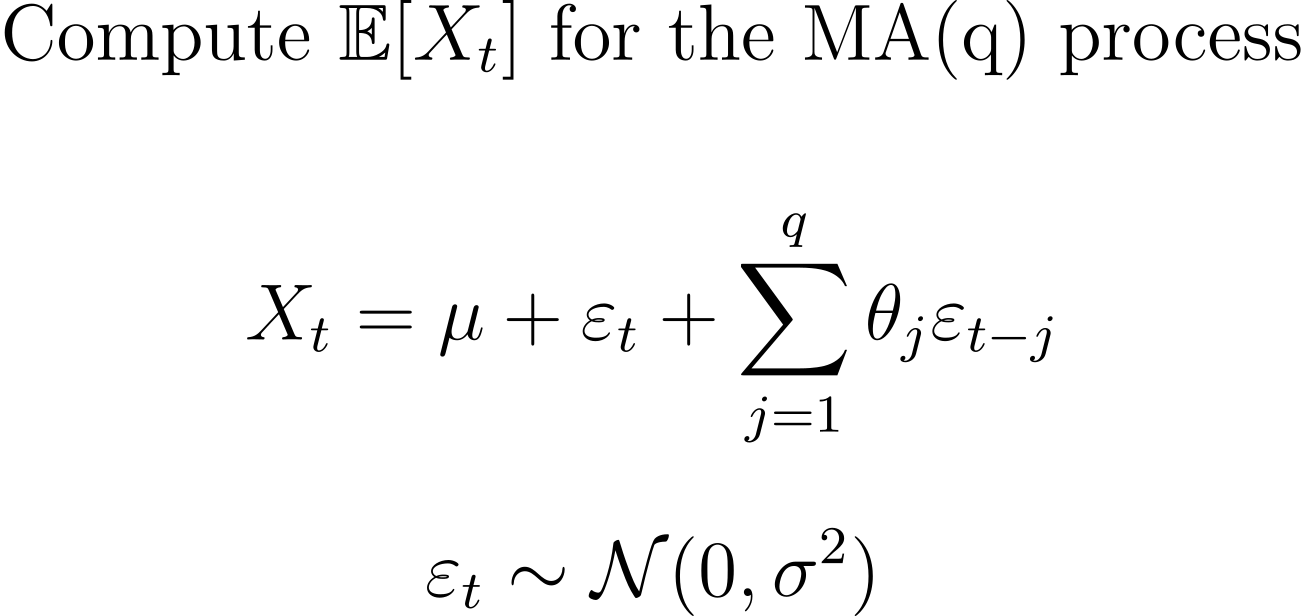
| Solution at the Bottom of this Email 👇 |
| | | Need to study up on topics in math, probability, and finance? 👉 Learn to solve problems like this on Quant Guild — the platform I wish I had when I was studying to become a quant. | | | 📅 Quant Guild Week in Review |
| Quant Interviews and Top 5 Quant Papers |
|
|
|
|---|
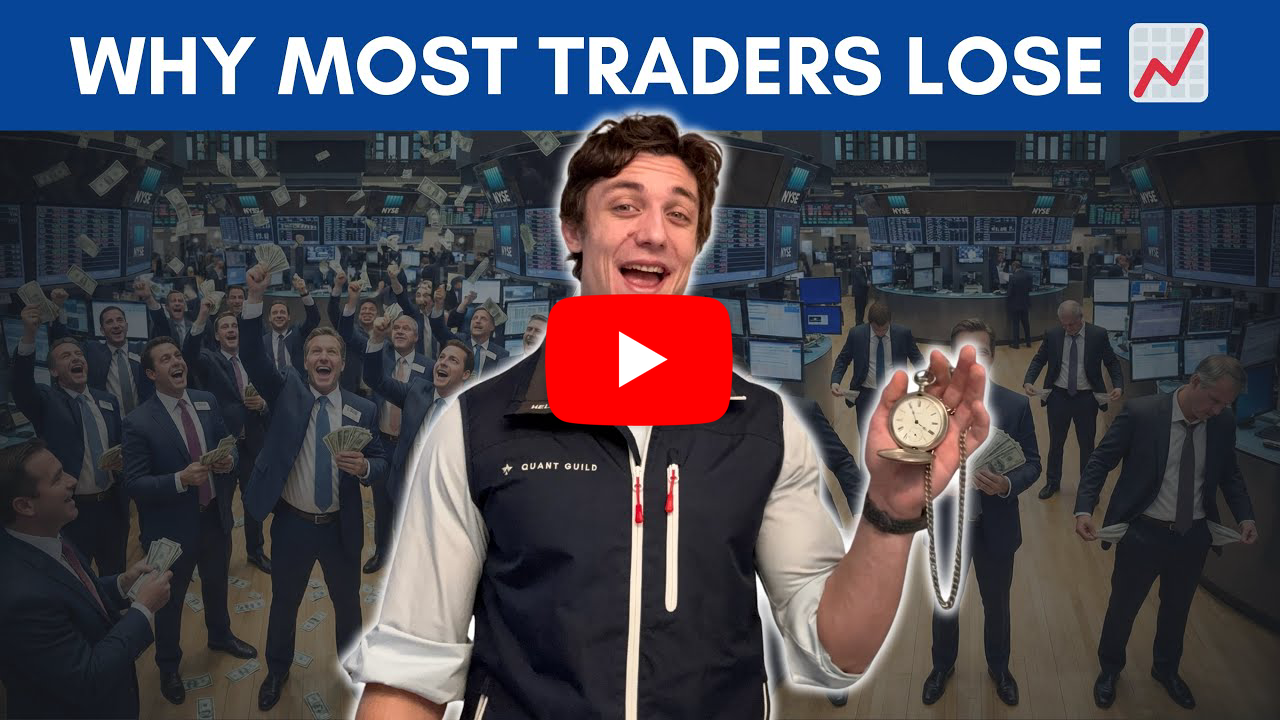
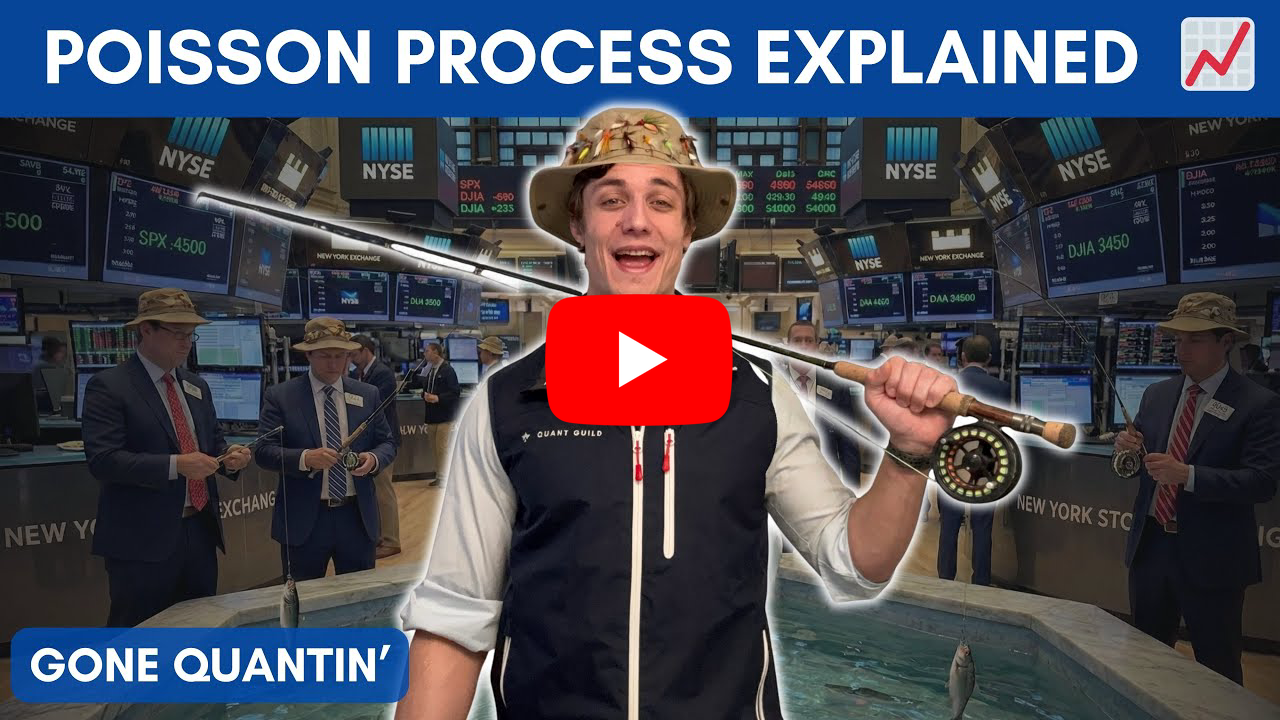
📈 My Approach to Solving Quant Interview Questions | In this video I explain why most traders lose money even when they have positive expected value, and the answer has nothing to do with indicators or psychology. It comes down to ergodicity and how wealth actually evolves over time in trading. I start by breaking down expected value into its components and explain why, in non-stationary environments like markets, edge is not fixed. It changes over time, and we never observe it directly. We are always estimating it imperfectly. I then introduce the critical distinction between ergodic and non-ergodic systems using additive versus multiplicative betting. In an additive system, the ensemble average equals the time average. If you have positive expected value, almost everyone eventually wins. In a multiplicative system, which is what trading actually is, the experience of the many is not the experience of the few. You can have positive expected value while most wealth paths go to zero. That is why “being right on average” is not enough to survive in markets. From there I show why bet sizing is the real control variable. I walk through simulations comparing fixed proportional betting to Kelly-optimal betting and explain why naïvely scaling bets with bankroll leads to ruin. This is where the Kelly criterion comes from. It maximizes long-run compound growth by optimizing the time average, not the ensemble average. However, I also explain why full Kelly is too aggressive in practice since our edge is uncertain and constantly changing. I finish by showing why practitioners use fractional Kelly and other conservative sizing rules. The goal is not to maximize theoretical growth under perfect information. The goal is to survive uncertainty, avoid ruin, and compound wealth over time in a non-ergodic world. Most traders fail because they optimize the wrong objective. Ergodicity explains why. Here's a link to the full video 👇 | | | 🎲 Top 5 Papers that Built Modern Quant Finance | In this video I break down Poisson processes from the ground up and show how they are actually used in quantitative finance. I start with the Poisson random variable and explain how it models rare events over a fixed time interval. In finance, this shows up everywhere: trade arrivals, price jumps, defaults, operational risk events, and fraud. I walk through the assumptions behind the model, independence, stationarity, and discrete counts, and explain where and why those assumptions break in real markets. From there I show how to estimate the Poisson parameter using maximum likelihood and how to use the calibrated model to answer real questions about jump risk. I demonstrate how mis-specifying the distribution in a non-stationary environment can completely destroy your probability estimates. Even small shifts in the underlying event rate can cause your model to underestimate tail risk by orders of magnitude, which is exactly why jump risk is so often mispriced. I then introduce the exponential distribution and explain why it governs waiting times between events. Its memoryless property is the key ingredient that allows Poisson processes to work. Once that intuition is in place, I formally define the Poisson process itself as a continuous-time counting process with independent and stationary increments. I use simulations to show how event counts converge to the Poisson distribution and how waiting times converge to the exponential distribution via the law of large numbers. Next, I move beyond the idealized case and explain why constant arrival rates are unrealistic. In practice, event intensity changes over time. I introduce time-inhomogeneous Poisson processes and show how the arrival rate can be modeled as a function of time or other variables, such as bid-ask spread in market making. I then connect this directly to the Hawkes process, which captures clustering behavior like volatility bursts and panic selling by allowing events to increase the likelihood of future events. The core takeaway is that Poisson processes give us a clean mathematical framework for modeling jumps and arrivals, but real markets require extensions that account for non-stationarity and clustering. Used correctly, these models play a central role in risk modeling, market microstructure, derivative pricing, and simulation. Used incorrectly, they produce probabilities that are wildly misleading. Here's a link to the full video 👇 | | |
|
|
|---|
|
 | 📈 Why 10,000+ Quants Study on Quant Guild | Quant Guild is the one-stop platform for mastering the math that powers modern finance. With 90+ specialized lessons, adaptive practice with gamified progress that scales with your skill level, real interview questions, courses from A - Z in coding, math, probability & statistics, and exclusive live classes with me, it’s built to take you from fundamentals to the front-office. Everything’s designed for how real quants think and work — focused, practical, and deeply technical. That’s why over 10,000+ students and professionals study on Quant Guild to sharpen their edge and make smarter decisions in the face of uncertainty. | 🏛️ See How Pol Became a Market-Maker with Quant Guild | | |  |
|
|
|---|
| | I'm in QR preparing for technical interviews and your practice helped me brush up on probability, thanks | | |
| | |
|
| | | I learned more here in two days than an entire semester of college | | |
| - Guy on Discord Who DM'd Me |
|
|
|
|---|
|
| | ✅ Quant Question of the Week |
| | | | | | |
|
|
|---|
|

 Roman Paolucci