 | | | 📜 A Note from the Guild Leader |
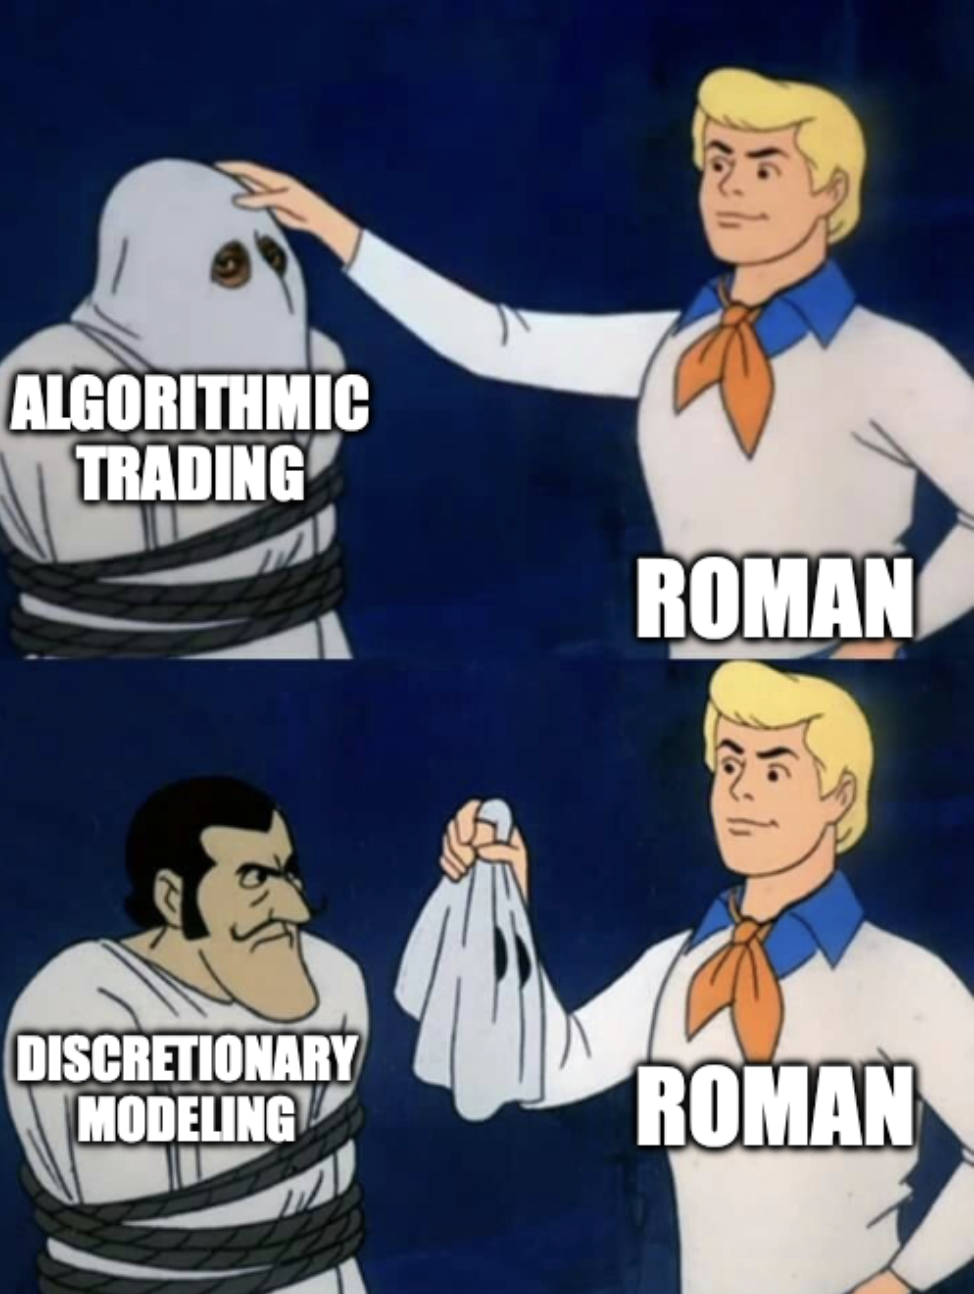
| Algorithmic trading, systematic trading: "removes the human bias, the emotion from decision making in your edge" says the common man on LinkedIn. Really? What about your model selection and parameterization? You'll construct a system for that? Sure. Based on what? Another system? Eventually you're gonna get to a "because I said so". | | | Algorithmic trading shifts discretionary components of entry and exit or overall portfolio construction to the modeling process. What model did you select AND WHY. What parameterization did you select AND WHY. THERE IS NOT ONE OPTIMAL WAY TO DO THIS. So what do we do? Well shocker, you need a tremendous amount of knowledge and experience to optimize the discretionary modeling process for good algorithmic trading performance. Asking for anything else is like asking "how do I get good at Poker overnight?" Knowledge and experience. That means you need to master your quantitative skills and experience model informed decision making to optimize the discretionary modeling component. Don't like it? Want a magic alpha button? Too bad, now go put in some work. | With that I will leave you to the Weekly Guild Letter. I hope you enjoy, and I hope you learn something! - Roman | | | 🧮 Quant Model of the Week |
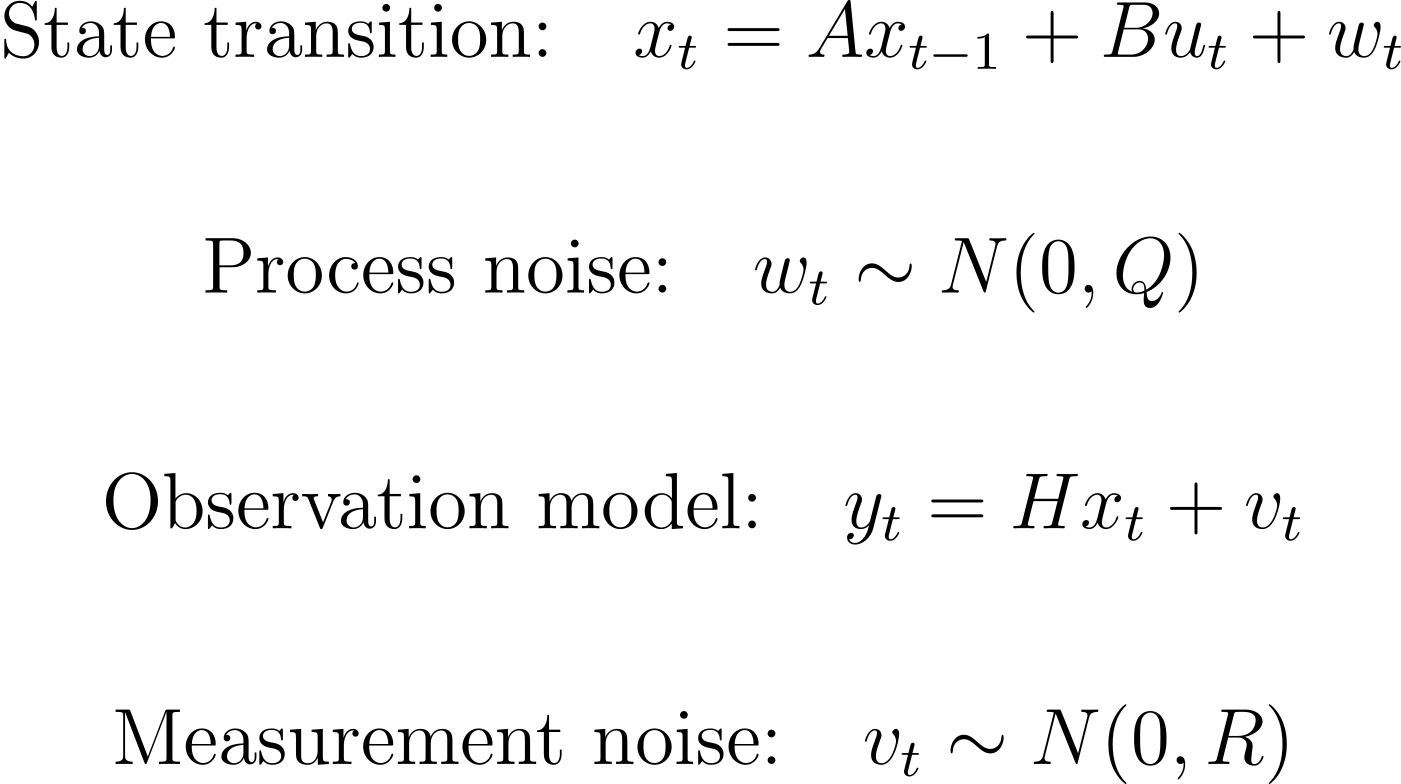
| | | Markets are noisy. Prices move, signals fluctuate, and the information we observe is often a distorted version of the underlying state we actually care about. If you try to model the raw observations directly, you end up chasing noise instead of structure. The Kalman filter solves this by separating what we see from what we believe is really happening. Instead of treating observations as truth, it assumes there is a hidden state evolving through time and that our measurements are just noisy glimpses of it. Each new observation updates our estimate, blending the prior belief with the new data in an optimal way. In practice, Kalman filters are used to estimate latent variables in real time. Trend extraction, dynamic hedge ratios, state-space models, signal smoothing, pairs trading spreads, and even tracking hidden volatility states all rely on this idea. Anywhere the system evolves over time but observations are noisy, the Kalman filter provides a disciplined way to infer the underlying process. This is what the state-space representation looks like. | | | At the heart of the Kalman filter is the state-space structure. Instead of modeling the data we observe directly, we assume there is a hidden system evolving underneath it. What we see is just a noisy measurement of that underlying state. The first piece is the state transition. The hidden state at time t evolves from the state at time t–1. A transition matrix determines how the previous state carries forward, and optional inputs can push the system if there are external drivers. On top of that, we add process noise, which captures the idea that even if we knew yesterday’s state perfectly, the system itself evolves with randomness. The second piece is the observation model. The data we observe is some transformation of the hidden state. But we do not observe the state perfectly. Instead, we see it through measurement noise, which represents the errors, microstructure noise, or distortions in the data. Hidden dynamics plus noisy observations. That is the core idea. The Kalman filter continuously blends its prior belief about the hidden state with new incoming data, updating the estimate in real time as more information arrives. | 📈 Model applications In practice, Kalman filters show up anywhere we need to estimate something that is moving but noisy. On the trading side, they are widely used for mean reversion strategies, especially in pairs trading and statistical arbitrage. Instead of assuming a fixed hedge ratio between assets, the Kalman filter allows that relationship to evolve through time. As new prices arrive, the filter updates the estimate of the spread and the hedge ratio, letting traders track a dynamic equilibrium rather than a static one. They are also useful for pricing illiquid or partially observed instruments. When markets are thin or quotes are noisy, the observed price may not reflect the true underlying value. The Kalman filter blends prior estimates with incoming trades or quotes to infer a smoother estimate of the latent fair price. In short, the Kalman filter helps institutions separate signal from noise. Whether estimating a drifting spread, a hidden state, or a fair value in a noisy market, the framework provides a disciplined way to update beliefs as new information arrives. | 🎓 A little story The first time I applied a Kalman filter in practice was for pricing illiquid bonds. What looks simple on a terminal screen, a clean evaluated price on the BVAL function, hides an enormous amount of engineering underneath. Hundreds of hours of quantitative work. Dozens of late nights. More than a few 3am meetings leading up to deployment. At first I thought the challenge was purely technical. Build the state-space model, calibrate the parameters, push the system live. But somewhere in the middle of that process it became obvious why this framework is used so widely. The Kalman filter is not just a clever algorithm. It is transparent. Every update has a structure. Every adjustment comes from a balance between the model’s belief and the new observation. That is where it really clicked for me. A lot of modern modeling discussions jump straight to machine learning. Throw data into a black box and hope the output works. But in markets, especially when you are pricing instruments that barely trade, that opacity is a liability. You need to know why the model moved the price. You need to understand how new information shifts the estimate. The Kalman filter gives you that. You see the gain. You see the uncertainty shrink or expand. The mechanism is explicit. After that experience, the appeal of the approach made perfect sense. It was not just about accuracy. It was about control. When you are responsible for producing prices that desks rely on, transparency is not a luxury. It is a requirement. 💡 Takeaway We do not use Kalman filters because they are mathematically elegant. We use them because markets are noisy, and decisions depend on separating signal from that noise. Prices, spreads, and relationships between assets move through time, but what we observe is often distorted by microstructure effects, illiquidity, and random fluctuations. If your model treats every observation as truth, you end up reacting to noise instead of the underlying state. The Kalman filter addresses this directly. It assumes there is a hidden process evolving beneath the data and updates our estimate of that process as new information arrives. The model prediction and the new observation are blended according to their relative uncertainty. That single mechanism allows the filter to track drifting signals, dynamic hedge ratios, and fair values in markets where the raw data is unreliable. But the Kalman filter is not the final model either. It is one more structural tool. Just like PCA focuses on dominant sources of variation, the Kalman filter focuses on extracting the dominant signal from noisy observations. The goal is not to perfectly reconstruct reality. It is to produce estimates that are stable enough, interpretable enough, and responsive enough to support trading, pricing, and risk decisions. | | | 🏆 Quant Question of the Week |
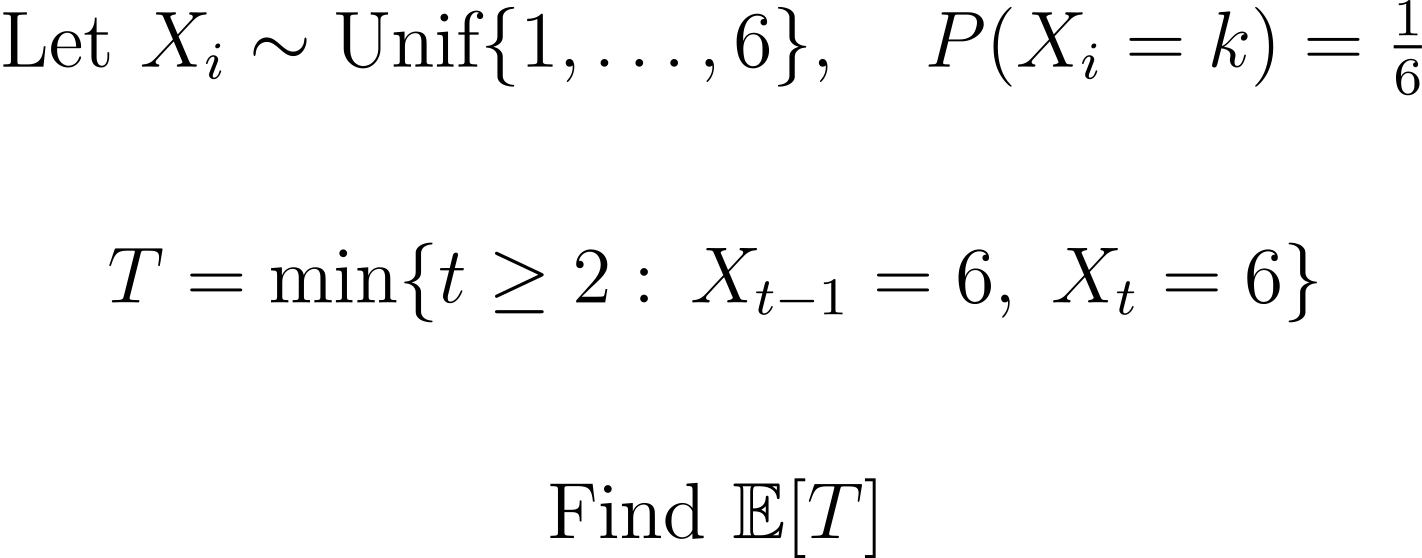
| Solution at the Bottom of this Email 👇 |
| | | Need to study up on topics in math, probability, and finance? 👉 Learn to solve problems like this on Quant Guild — the platform I wish I had when I was studying to become a quant. | | | 📅 Quant Guild Week in Review |
| Trading Mean Reversion and Alpha |
|
|
|
|---|
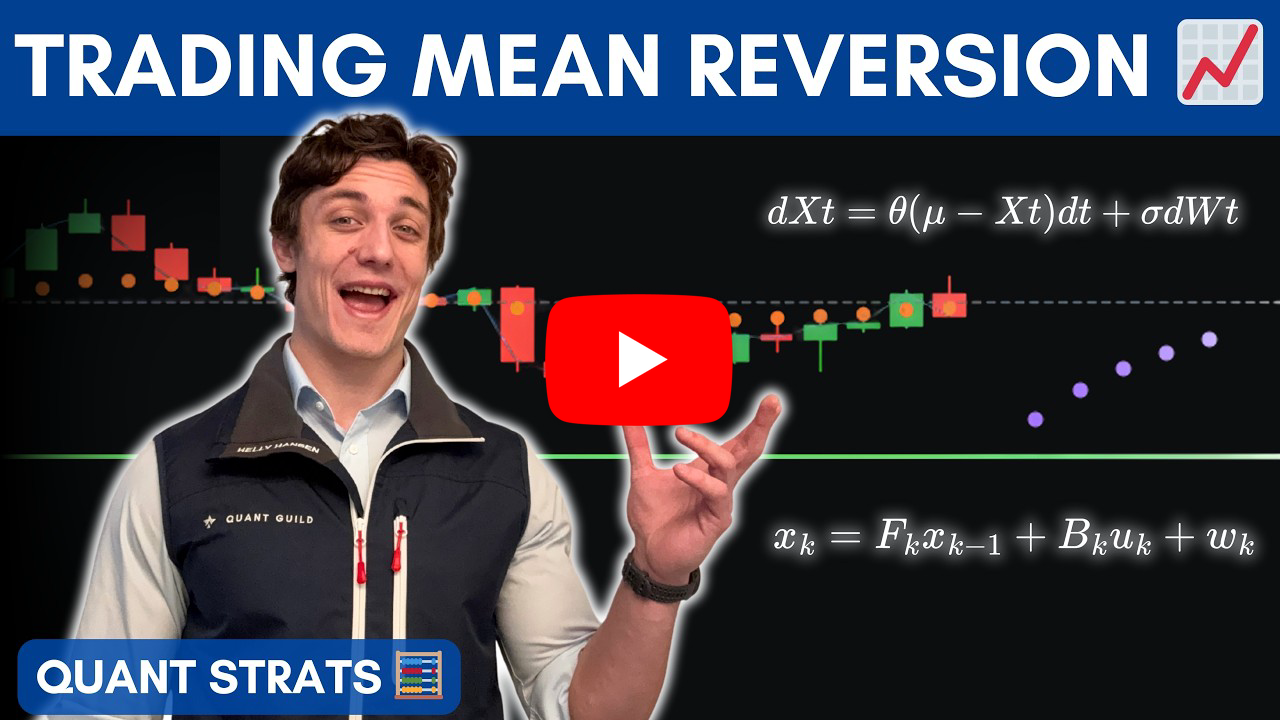
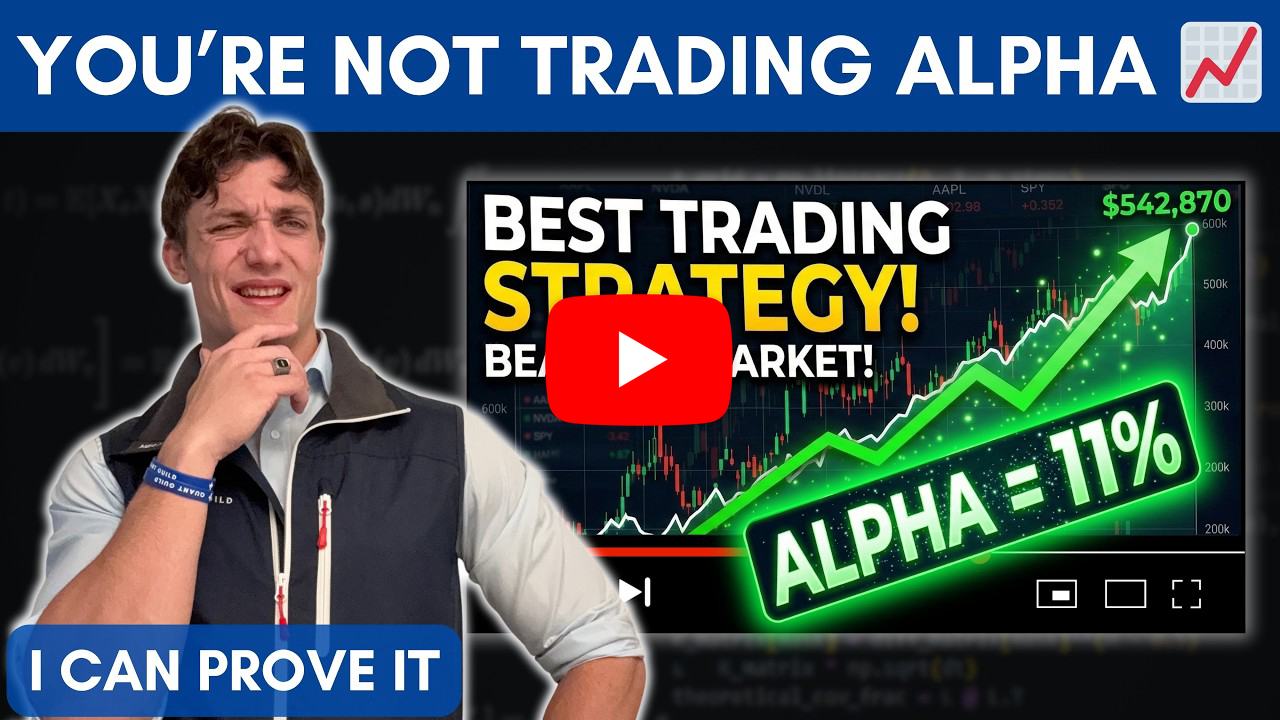
📈 Trading Mean Reversion with Kalman Filters | In this video I explain how a mean reversion trading strategy moves from theory into a live trading system. I start in the classroom with the Ornstein Uhlenbeck process, which is the standard mathematical model for mean reversion. In theory, if prices revert to a stable long run mean, we can estimate that mean from observed data and trade around it. When prices fall far below the mean we go long, when they rise far above it we go short. If the process truly follows those dynamics and our bet sizing is reasonable, the equity curve should steadily accumulate returns over time. The challenge is that the real world does not behave like the classroom. Financial markets are non stationary. There is no fixed long run mean and the parameters of the process can change across time. A strategy that works for a period can stop working as the underlying dynamics shift. The critical problem then becomes determining when the mean has changed and how much historical data should be used to estimate it. If you continue trading around a stale estimate of the mean, the strategy quickly breaks down. This is where the Kalman filter becomes useful. The filter combines two sources of information. The first is our model assumption, in this case that the price behaves like a mean reverting process. The second is the live market data we observe. The Kalman filter continuously updates the estimated mean by balancing these two inputs. It adjusts the model’s belief about the mean as new information arrives, allowing the system to adapt as the market evolves. That adaptability introduces a tradeoff. If we trust the model too much, the system becomes rigid and reacts slowly to changing market conditions. If we trust the data too much, the filter becomes overly sensitive to noise and the strategy gets whipsawed by short term fluctuations. The quant’s job is to balance those two forces. There is no free lunch. The main takeaway is that mean reversion strategies do not succeed because we know the true mean. We never do. They succeed because we can estimate it well enough and adapt when it changes. Tools like the Kalman filter help bridge theory and practice by combining model assumptions with real time market information. Here's a link to the full video 👇 | | | 🎲 I Bet You've Never Found Alpha (and I Can Prove It) | In this video I break down one of the biggest misconceptions in trading and portfolio management. Most strategies that appear profitable are not actually generating alpha. They are simply riding market beta. I start with a real story about reviewing a portfolio managed by an asset manager who claimed expertise, but whose performance was nothing more than exposure to the broader market. That example sets the stage for a deeper discussion about what is really happening under the hood of most trading strategies. I begin by explaining the distinction between beta and alpha through the lens of the Capital Asset Pricing Model. Beta represents exposure to the broader market. It is the wind that pushes returns higher during good times and lower during downturns. Alpha, by contrast, represents returns that are orthogonal to the market. These are returns generated by actual inefficiencies or skill, not by simply participating in the market’s upward drift. To illustrate the difference, I walk through a typical moving average trading strategy that appears profitable when you look only at the equity curve. At first glance it looks like a legitimate signal. The returns trend upward, the Sharpe ratio is reasonable, and the drawdowns appear manageable. But when we regress the strategy against the market, we discover the truth. The beta is essentially one, meaning the strategy’s performance is entirely explained by market exposure. There is no alpha. Even attempts to improve the strategy through regime filtering fail to produce real alpha. I demonstrate this by introducing a Markov chain volatility regime model and only trading during low volatility periods. On the surface this looks more sophisticated. However, when we run the regression again, the alpha is still statistically insignificant. The strategy is still just beta in disguise. The larger lesson is that generating true alpha is extremely difficult. There is an inverse relationship between how easy a signal is to construct and how effective it actually is. Simple indicators and retail style backtests rarely uncover real inefficiencies. Genuine alpha typically requires large datasets, complex feature engineering, cross sectional modeling, and a deep understanding of risk premia versus true orthogonal returns. The takeaway is straightforward. Before claiming an edge, you must separate beta exposure from genuine alpha. Most traders never do this. They mistake market participation for skill. Here's a link to the full video 👇 | | |
|
|
|---|
|
 | 📈 Why 10,000+ Quants Study on Quant Guild | Quant Guild is the one-stop platform for mastering the math that powers modern finance. With 90+ specialized lessons, adaptive practice with gamified progress that scales with your skill level, real interview questions, courses from A - Z in coding, math, probability & statistics, and exclusive live classes with me, it’s built to take you from fundamentals to the front-office. Everything’s designed for how real quants think and work — focused, practical, and deeply technical. That’s why over 10,000+ students and professionals study on Quant Guild to sharpen their edge and make smarter decisions in the face of uncertainty. | 🏛️ See How Pol Became a Market-Maker with Quant Guild |  |  |
|
|
|---|
| | I'm in QR preparing for technical interviews and your practice helped me brush up on probability, thanks | | |
| | |
|
| | | I learned more here in two days than an entire semester of college | | |
| - Guy on Discord Who DM'd Me |
|
|
|
|---|
|
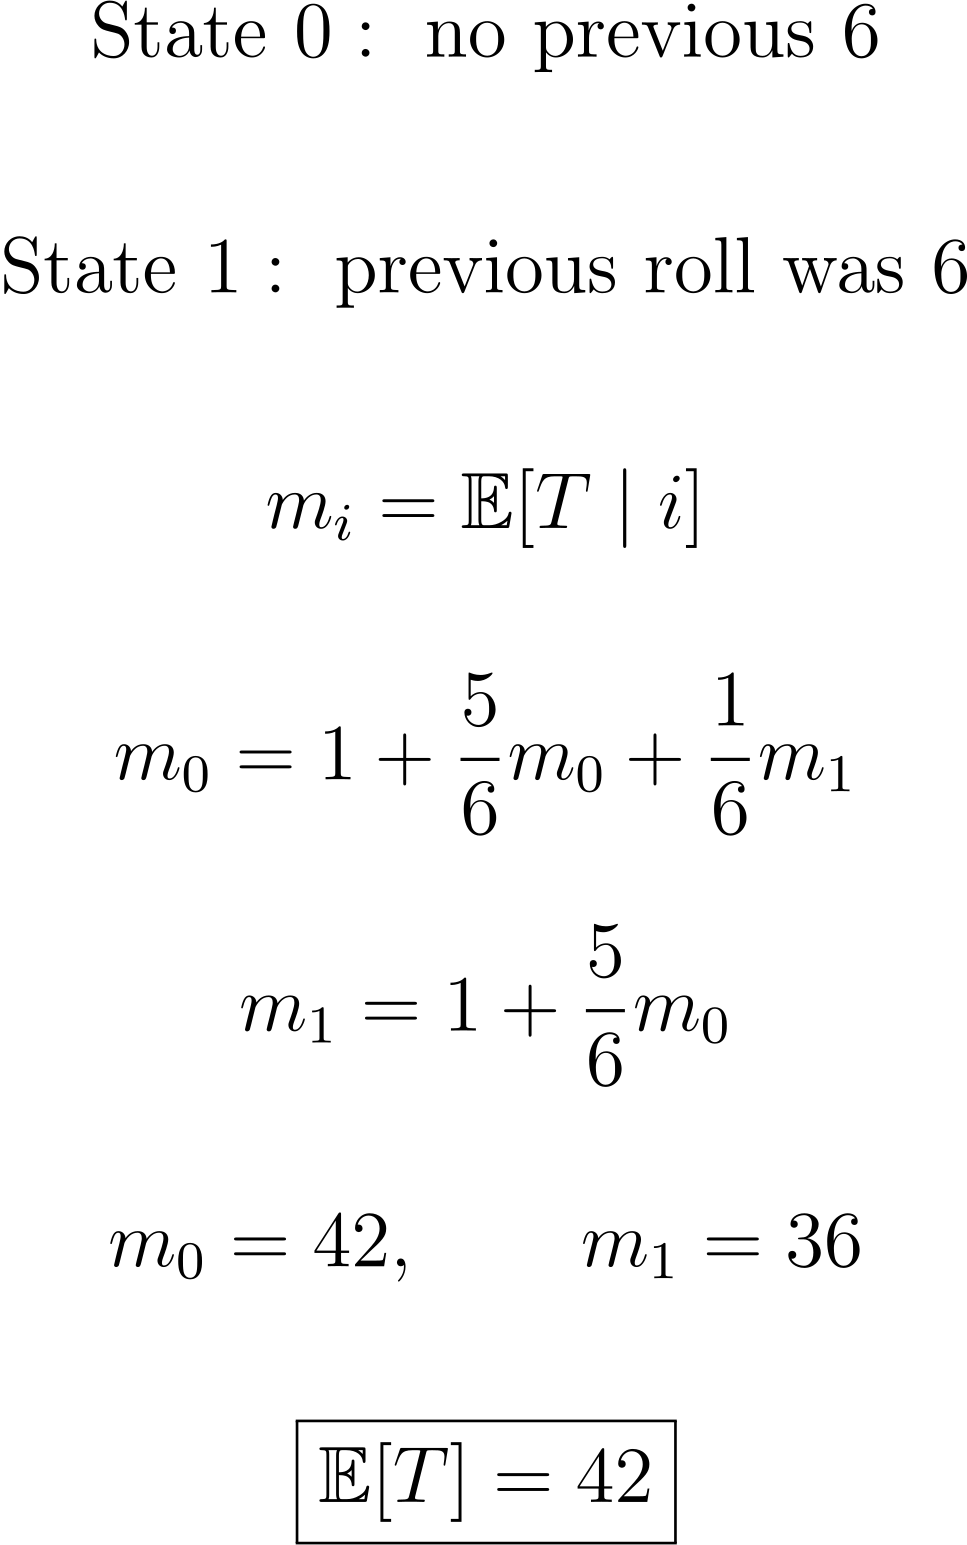
| | ✅ Quant Question of the Week |
| | | | | | |
|
|
|---|
|

 Roman Paolucci