 | | | 📜 A Note from the Guild Leader |
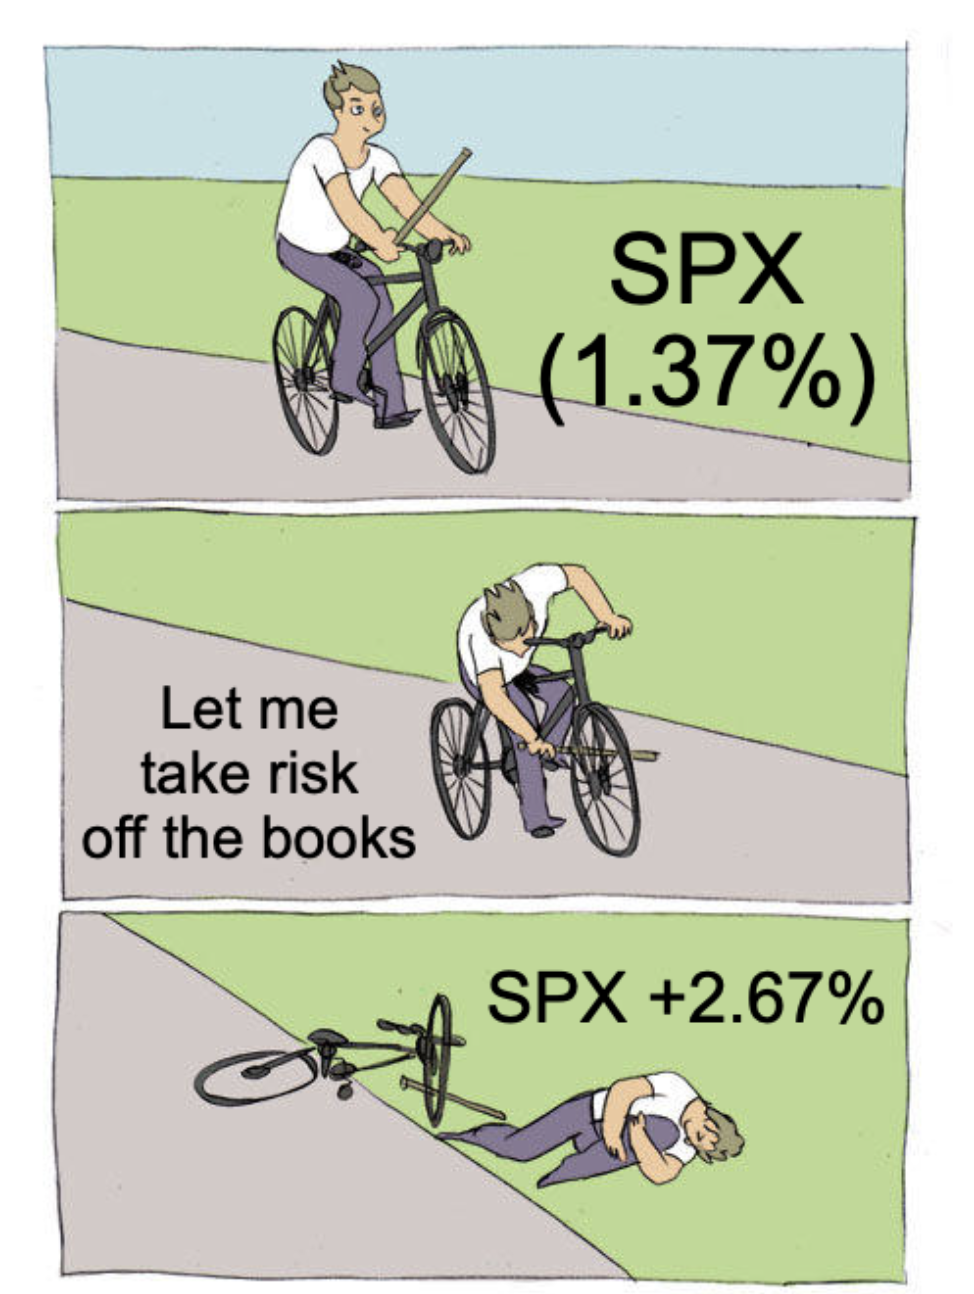
| I was long against hiring asset & wealth managers, an opinion I held strongly right out of school and into the first few years of my career as a quant. Paying a fee to hold the market portfolio always seemed outrageous, or even worse, the idea that the service was being marketed as some insider knowledge or expertise that generated alpha was, at least to me, hysterical. My previously strong opinion has been flipped entirely on its head observing the tendency of clients operating in both a trading and investing capacity. Example Client Behavior: | | | Getting involved in the quantitative finance (trading/investing) space typically means surrounding yourself with colleagues, peers, and mentors that live and breathe the knowledge required to function in the field. All of us (hopefully) know what the difference between alpha and beta is. The difference between passive and active management. Trading and investing, so on and so forth. However, until we have client exposure (if at all), we forget that our clients make their money doing pretty much anything else. From successful exits to inheritances, these folks don't know what the market portfolio is, and they probably don't care. They just want their money to make more money or retain its value. Should they seek out the best manager they can find? Absolutely, but if the guy they golf with charges 1% and they feel like he knows what's going on he's won their business. Real quantitative finance isn't just about mass producing alpha but also managing and prioritizing relationships and capital. You can have the best strategy in the world, but if nobody likes you they won't give you their money. Oh the irony, you can have the worst strategy in the world but if everyone loves you, you will win their capital. Let me know the last time you've heard that perspective from a quant. In any case, I've seen the behavior in the meme above play out too many times. Some close friends, some old colleagues, even old clients. They loose tens of thousands of dollars primarily due to lack of knowledge and experience. Can't blame them, you see your portfolio bleeding cash and you don't know why, what should you do? Well naturally you want to stop the bleeding, but they're just ripping the bandage off before it clots and wondering why they're worse off than when they started. Yeah, they probably should've just paid a wealth or asset manager the 1-2%... Don't be the guy in the meme, don't be the guy with alpha everyone hates. If anything be the guy pleasant to golf with, at least everyone feels like they're winning in that case. So is 1% a ripoff for holding the market portfolio? If you feel that way I've been there, but look around, this isn't a business school project... | With that I will leave you to the Weekly Guild Letter. I hope you enjoy, and I hope you learn something! - Roman | | | 🧮 Quant Model of the Week |
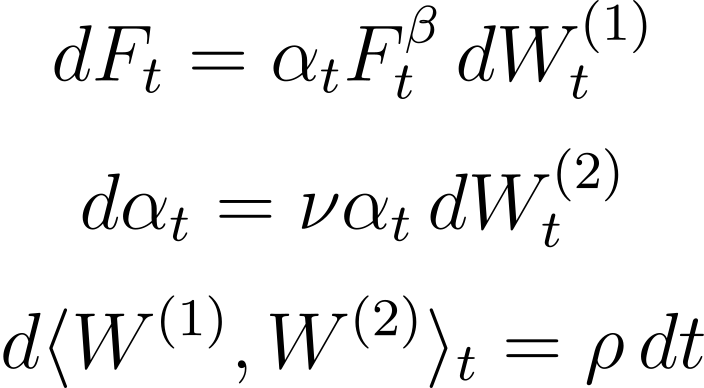
| | | Markets do not exhibit constant volatility. Option prices reveal smiles and skews that shift as prices move and regimes change. A model with fixed volatility cannot reproduce these dynamics. The SABR model addresses this by making volatility stochastic and correlated with the underlying. The asset evolves with a volatility that itself follows a diffusion, and the correlation between the two generates the skew observed in real option markets. Down moves increasing volatility, and the resulting smile structure, emerge naturally from this interaction. In practice, SABR is widely used to model and interpolate implied volatility surfaces, particularly in interest rate and FX options. Traders calibrate it to market smiles to obtain arbitrage-consistent vol surfaces, price off-strike options, and manage risk across strikes and maturities. Anywhere the shape and evolution of the volatility smile matter, SABR provides a tractable framework. This is what the SABR dynamics look like. | | | There are four core parameters that shape the behavior. First is beta, which controls how the volatility scales with the level of the asset. When beta is one the process behaves like a lognormal model similar to Black–Scholes. When beta is zero the dynamics resemble a normal model. Intermediate values interpolate between the two and determine the curvature of the smile. Second is alpha, the instantaneous volatility level. This acts as the starting point for the volatility process and determines the overall scale of the smile. Third is nu, often called the volatility of volatility. This governs how aggressively the volatility process itself fluctuates. Larger values generate more pronounced smile dynamics. Fourth is rho, the correlation between the shocks driving the asset and the shocks driving volatility. This parameter is responsible for the skew observed in real markets. Negative correlation produces the familiar downward equity-style skew where volatility rises as prices fall. Two coupled diffusions plus a correlation structure. That interaction between the asset and its own stochastic volatility is what allows SABR to reproduce the smiles and skews observed in option markets. | 📈 Model applications In practice, SABR is used anywhere the shape and dynamics of the volatility smile matter. On trading desks, especially in interest rate and FX options, SABR is calibrated to market implied volatilities to generate an arbitrage-consistent volatility surface across strikes. Instead of quoting every option independently, traders fit the SABR parameters to observed market prices and use the resulting surface to interpolate and extrapolate volatilities for strikes that are not actively traded. The model is also central to risk management and hedging. Because SABR captures skew and smile dynamics through the correlation and volatility-of-volatility parameters, it provides a framework for managing exposure not just to volatility levels but to the curvature and slope of the implied surface. In short, SABR helps institutions translate sparse option prices into a coherent volatility surface. By parameterizing the interaction between the underlying asset and its stochastic volatility, the model provides a practical way to price, hedge, and manage risk across the entire smile rather than treating each strike in isolation. | 🎓 A little story The first time I really saw SABR used in production was during an engagement with an options market maker. Going in, I had the usual academic intuition about models. You read about stochastic volatility, diffusion dynamics, closed-form approximations, and it all feels very theoretical. Then you see the actual pricing stack. Their primary engines were a combination of trinomial trees and SABR. The tree handled the pathwise mechanics and discrete pricing logic. SABR handled the volatility surface. Every quote, every risk calculation, every recalibration of the smile was flowing through that structure. It was not a toy model sitting in a textbook. It was the machinery behind the prices traders were actually quoting to the market. What stood out immediately was how disciplined the workflow was. The surface was calibrated to observed options, the parameters updated as the market moved, and the tree used those dynamics to propagate prices and risks. Everything had a reason. Every number on the screen came from a model you could inspect, stress, and explain. That was when the gap between academic models and trading models really closed for me. In school, SABR feels like one more stochastic volatility model in a long list. On a trading desk, it is infrastructure. A practical way to translate a handful of market prices into a full volatility surface that traders can quote, hedge, and manage risk against in real time. 💡 Takeaway The takeaway is that SABR exists for a very practical reason: markets trade volatility surfaces, not single vol numbers. A constant-volatility model cannot reproduce the smiles and skews we actually see in option markets. SABR introduces just enough structure, stochastic volatility, scaling through beta, correlation-driven skew, and volatility-of-volatility, to capture the dominant geometry of those surfaces without becoming computationally unwieldy. But SABR is not a perfect description of reality. It is a parameterization. A way to compress a complex implied volatility surface into a small set of interpretable parameters that traders can calibrate, update, and risk manage in real time. The goal is not to explain every wrinkle in the market. It is to produce a stable, arbitrage-consistent surface that allows desks to quote prices and hedge exposures across strikes and maturities. That balance is the real lesson. Models like SABR succeed not because they are complete, but because they are tractable, interpretable, and good enough to run a market on. | | | 🏆 Quant Question of the Week |
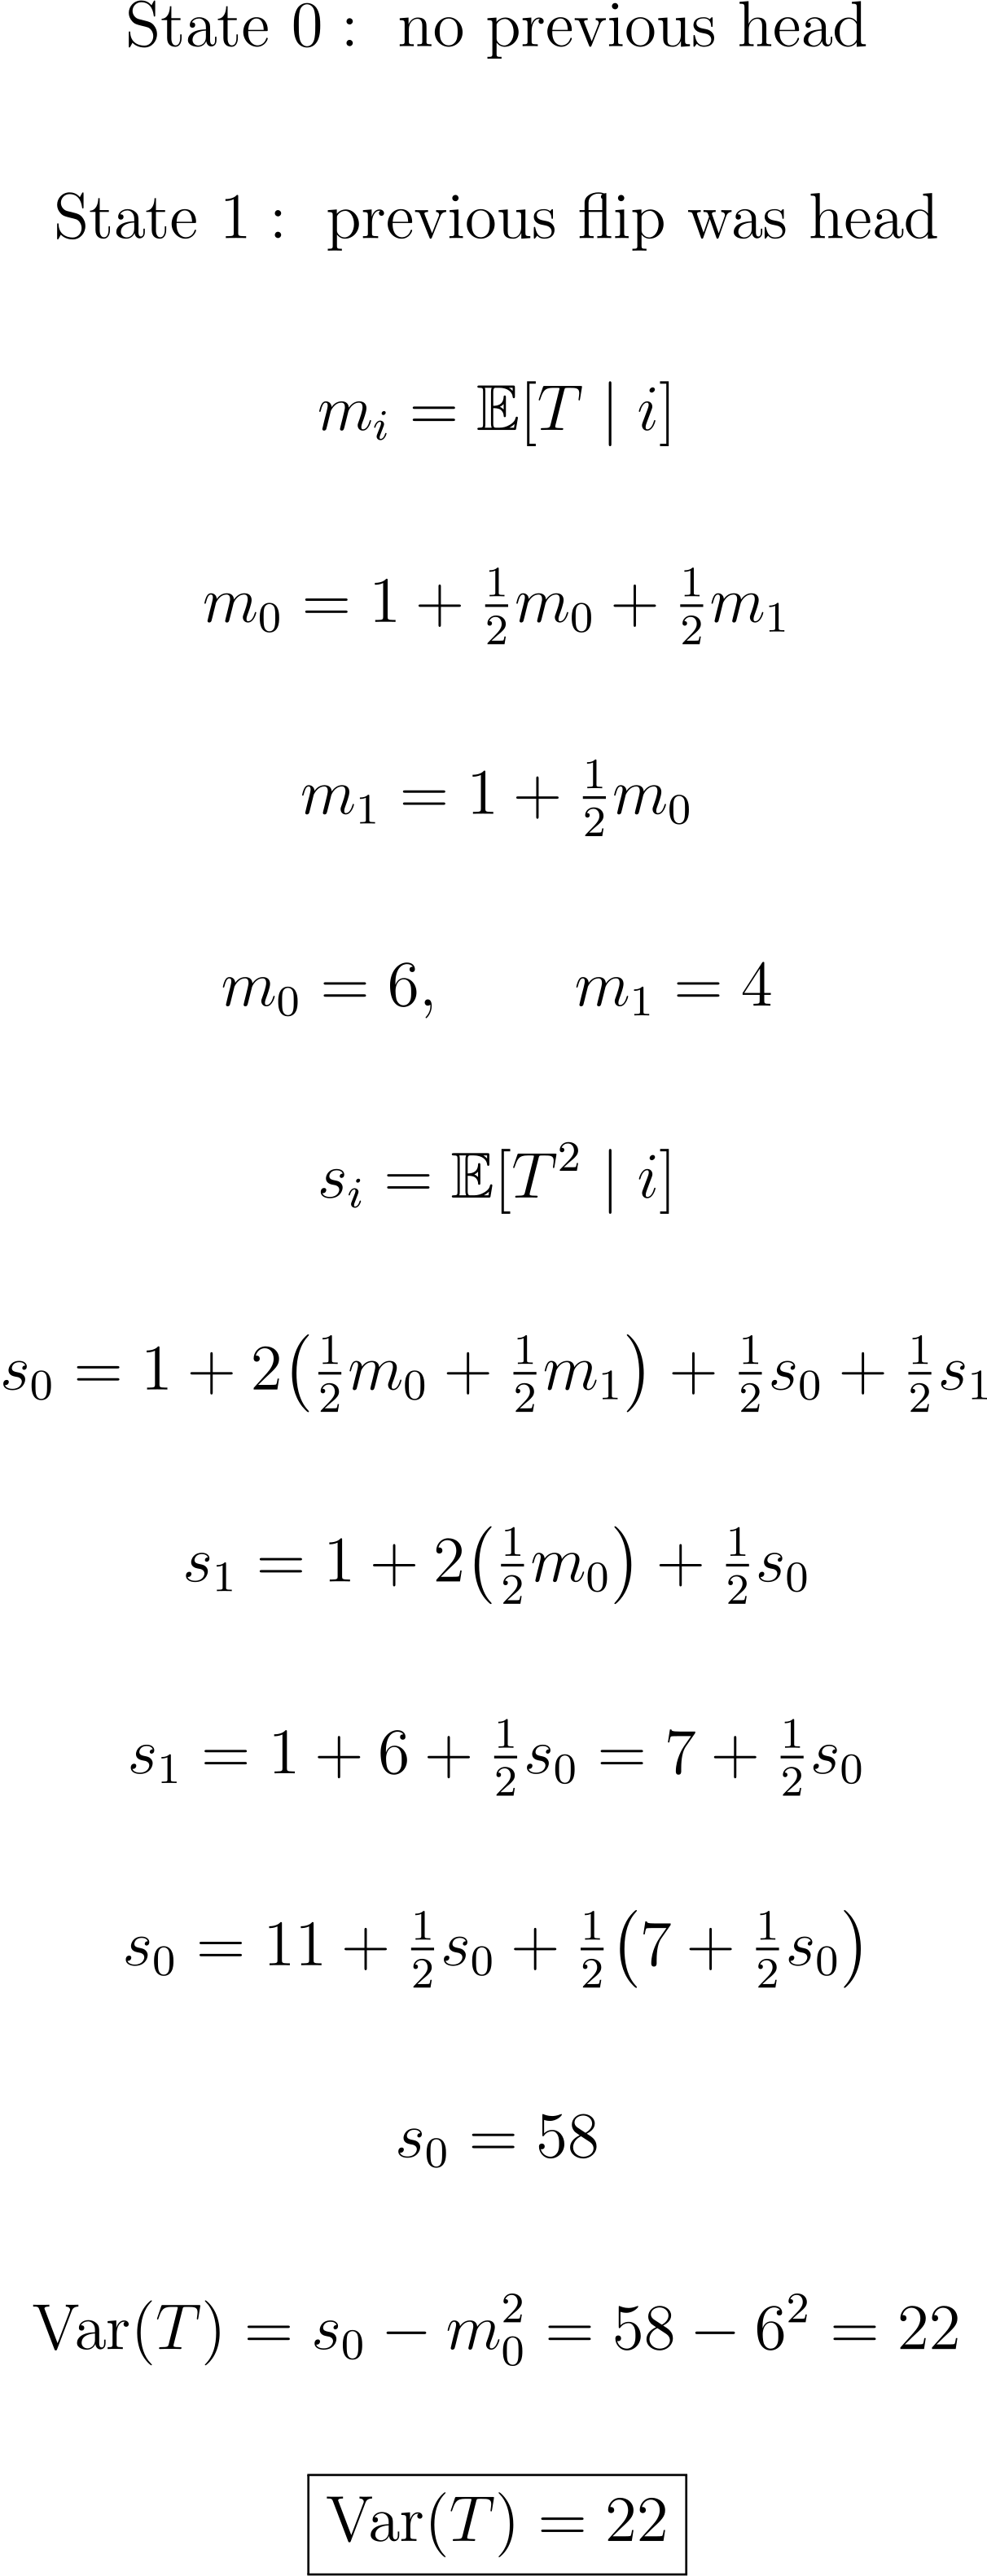
| Solution at the Bottom of this Email 👇 |
| | | Need to study up on topics in math, probability, and finance? 👉 Learn to solve problems like this on Quant Guild — the platform I wish I had when I was studying to become a quant. | | | 📅 Quant Guild Week in Review |
| Backtesting Pitfalls and Historical Stock Data |
|
|
|
|---|
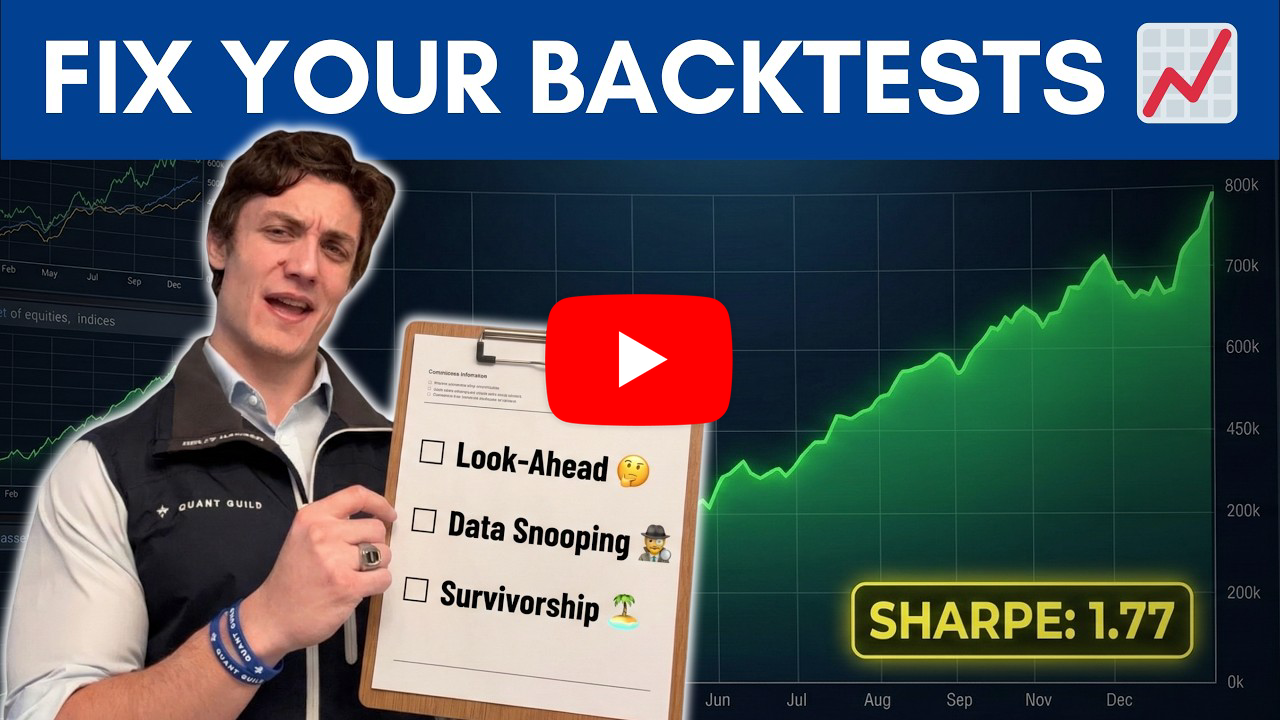
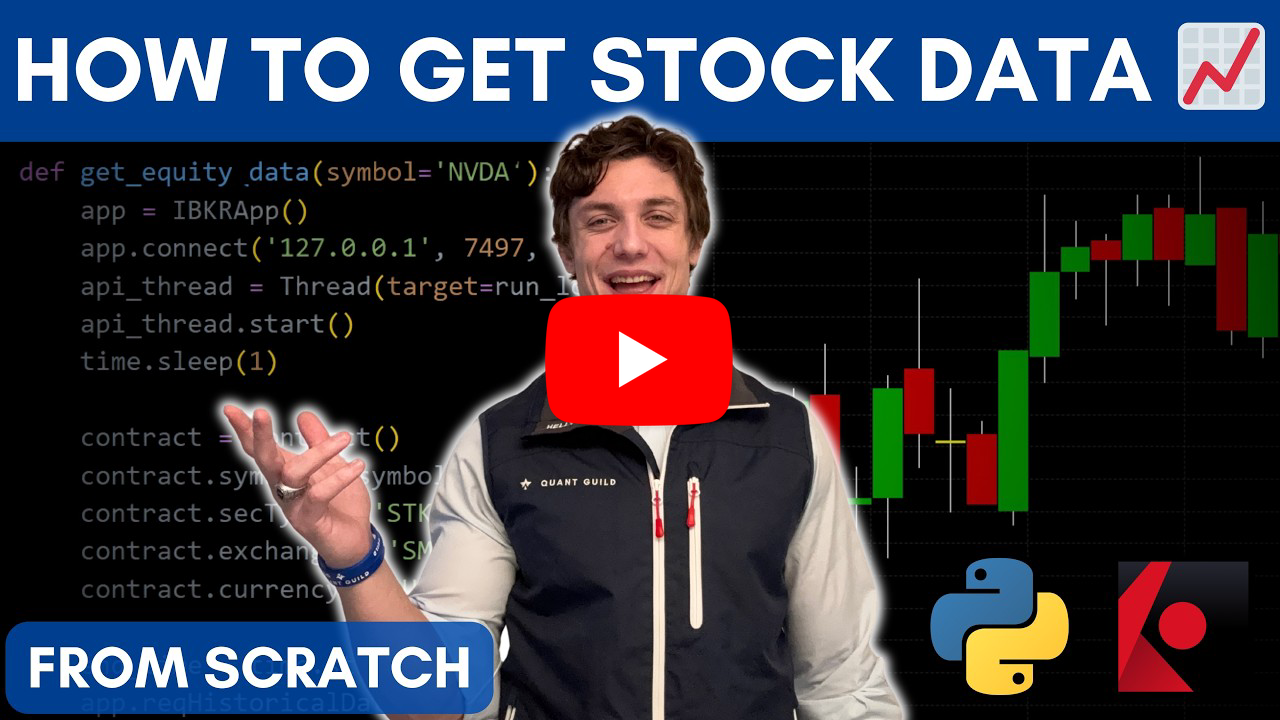
📈 3 Backtesting Pitfalls That Ruin Your Trading Strategy | In this video I explain why most trading strategies fail the moment they hit live markets. A beautiful backtest is not proof of success. In the quant world it is often a crime scene. Many strategies collapse not because the market changes but because the underlying statistics were flawed from the beginning. I walk through the three most common backtesting mistakes that quietly destroy strategies before they ever go live. The first pitfall is look ahead bias. This occurs when a backtest accidentally uses information that would not have been available at the time a trading decision was made. When you mix future data with current signals, even subtly through misaligned timestamps or improperly processed datasets, the strategy begins to look far more predictive than it really is. Once you correct the data so that the model only sees information available at the time of the trade, performance often collapses. The second pitfall is data snooping or overfitting. This happens when we repeatedly adjust model parameters until we find a configuration that performs well on historical data. For example, testing dozens or hundreds of moving average combinations and selecting the one with the highest Sharpe ratio may look convincing in sample. But the model has simply memorized the noise in the dataset rather than learning any real structure. When deployed on unseen data, the performance typically degrades dramatically. Techniques such as walk forward validation help mitigate this problem by forcing the model to prove itself on data it has never seen before. The third pitfall is survivorship bias. This occurs when a backtest only includes assets that survived into the present while ignoring those that failed or were delisted. The result is an overly optimistic performance estimate because the worst outcomes have been quietly removed from the dataset. A realistic backtest must include the full historical universe of assets that existed at each point in time, including firms that eventually disappeared. I also briefly mention practical frictions such as transaction costs, spreads, and slippage. These are not the primary sources of failure. If a strategy does not survive the statistical pitfalls in the classroom, adding real world costs will only make the outcome worse. The main takeaway is that backtesting is powerful but often misused. A robust strategy must respect the information available at the time of the trade, avoid overfitting through disciplined validation, and include the full historical universe of assets. Only then can a backtest begin to approximate reality. Here's a link to the full video 👇 | | | 🎲 How to Get Historical Market Data with Interactive Brokers and Python | In this video I walk through the full process of obtaining historical market data using Interactive Brokers and Python. If you want to backtest trading strategies or follow along with quantitative builds, the first thing you need is a reliable data source. Historical data is the foundation of any quantitative workflow. Without it, you cannot test models, validate strategies, or analyze market behavior. I start by explaining how to set up an Interactive Brokers account and configure the necessary market data subscriptions. Once the account is funded and the correct data feeds are enabled, the next step is installing Trader Workstation and preparing it to communicate with Python through the Interactive Brokers API. This requires enabling API access, verifying the correct socket port, and ensuring that the local client can connect to the trading platform. From there I walk through the Python implementation required to request historical data. The process involves importing the Interactive Brokers API libraries, building a class that can both send requests and receive responses, and defining callback methods that capture incoming market data. Each data bar returned by the API contains information such as open, high, low, close, and volume, which we store and later convert into a structured dataset. Once the connection is established, we specify the contract we want to query, such as an equity ticker, define the time range and bar size for the historical data request, and send that request to the Interactive Brokers server. The server returns the data bar by bar, which we collect, format into a pandas DataFrame, and save to a CSV file for further analysis or backtesting. The key takeaway is that obtaining historical market data is mostly infrastructure. It is the plumbing that allows quantitative research to begin. Once the pipeline is built, you can systematically pull price data, store it, compute returns, and integrate it into backtesting frameworks or model development workflows. Here's a link to the full video 👇 | | |
|
|
|---|
|
 | 📈 Why 10,000+ Quants Study on Quant Guild | Quant Guild is the one-stop platform for mastering the math that powers modern finance. With 90+ specialized lessons, adaptive practice with gamified progress that scales with your skill level, real interview questions, courses from A - Z in coding, math, probability & statistics, and exclusive live classes with me, it’s built to take you from fundamentals to the front-office. Everything’s designed for how real quants think and work — focused, practical, and deeply technical. That’s why over 10,000+ students and professionals study on Quant Guild to sharpen their edge and make smarter decisions in the face of uncertainty. | 🏛️ See How Pol Became a Market-Maker with Quant Guild |  |  |
|
|
|---|
| | I'm in QR preparing for technical interviews and your practice helped me brush up on probability, thanks | | |
| | |
|
| | | I learned more here in two days than an entire semester of college | | |
| - Guy on Discord Who DM'd Me |
|
|
|
|---|
|
| | ✅ Quant Question of the Week |
| | | | | | |
|
|
|---|
|

 Roman Paolucci