 | | | 📜 A Note from the Guild Leader |
| I've been thinking a lot about survival recently and why most people can't shouldn't trade or even manage their own investments. Ephemerally, good decisions are not classified by the quality of the decision making process, but rather the P/L they carry. This couldn't be further from what's required of an active risk taker: to accumulate your statistical edge over time. There are statistical mechanisms to do this. Don't be Jerry. | | | Within that framework lies how much notional exposure you're willing to take relative to net liq - structurally uncorrelated small (potentially levered) positive EV bets are the key to success. Survival is the game, your edge makes you path agnostic. Unfortunately, given the immense number of retail traders we will see big wins and "profitability" by random chance. This may last for one or a few years, even being hosted on popular trading shows like TastyLive. Confirmation and survivorship bias are one hell of a drug. | With that I will leave you to the Weekly Guild Letter. I hope you enjoy, and I hope you learn something! - Roman | | | 🧮 Quant Model of the Week |
| | | Interest rates are not just a single number. They form a curve that shifts shape through time. The Nelson–Siegel model takes a simple approach to capturing that shape. Instead of modeling every point on the curve independently, it describes the entire term structure using a small number of interpretable components. At its core, the model decomposes the curve into three pieces: a long-term level, a short-term slope, and a medium-term curvature. These components combine in a smooth, exponential form that can flexibly fit most yield curve shapes observed in practice. In real markets, this is powerful. You reduce a complex curve into a few parameters that can be estimated, tracked, and traded. Movements in rates become movements in level, steepening or flattening, and changes in curvature. | 🧮 Model Definition | This is what the Nelson–Siegel model looks like. | | | At a high level, the Nelson–Siegel model is controlled by a small set of intuitive parameters that shape the entire yield curve. First is β₀ (beta zero), the level. This represents the long-term rate the curve converges to as maturity increases. If you move β₀ up or down, the entire curve shifts with it, especially at the long end. Second is β₁ (beta one), the slope. This primarily affects the short end of the curve. It captures the difference between short-term and long-term rates. A large negative β₁ typically produces an upward sloping curve, while a positive one can flatten or invert it. Third is β₂ (beta two), the curvature. This controls the “hump” in the middle of the curve. It allows the model to capture situations where medium-term rates are higher or lower than both short and long rates. Finally, there is λ (lambda), the decay parameter. This determines where that curvature shows up along the maturity axis. Smaller values push the hump toward shorter maturities, while larger values move it further out. Put together, these parameters let you describe most real-world yield curve shapes using just a few moving parts: level, slope, curvature, and where the curvature sits. | 📈 Model Applications | In practice, the Nelson–Siegel model is used to summarize and trade the yield curve with just a few factors. On rates desks, it provides a clean way to decompose movements into level, slope, and curvature, making it easier to understand and position for shifts like steepening, flattening, or hump changes. It is widely used for curve fitting and interpolation, turning sparse bond data into a smooth, consistent term structure for pricing bonds, swaps, and interest rate derivatives. It also plays a role in risk management, where exposures are measured in terms of sensitivities to the three factors rather than individual maturities. | 🎓 A Little Story | The first time I really saw the yield curve, not just as numbers, but as a structure, something broke in my head. Up until that point, everything was YTM. One bond, one yield, done. It felt clean. But the moment you lay out rates across maturities, 3 months, 2 years, 10 years, 30 years, that simplification falls apart instantly. There is no single yield. There is a shape. And that shape matters. Short rates move differently than long rates. The curve steepens, flattens, inverts. Two bonds can have the same yield to maturity and behave completely differently depending on where they sit on the curve. YTM stopped feeling like a measure and started feeling like a shortcut that hid the real story. That was the shift. You do not price or manage risk with a single number. You think in curves. Once you see that, you cannot go back. | 💡 Takeaway | YTM is a shortcut. The yield curve is the reality. Markets do not move in single numbers, they move in shapes. Level, slope, curvature. If you reduce everything to one yield, you miss how risk is actually distributed across time. Once you start thinking in curves, pricing, hedging, and trading all change. You stop asking “what is the yield?” and start asking “how is the curve moving?” That is where the real signal is. | | | 🏆 Quant Question of the Week |
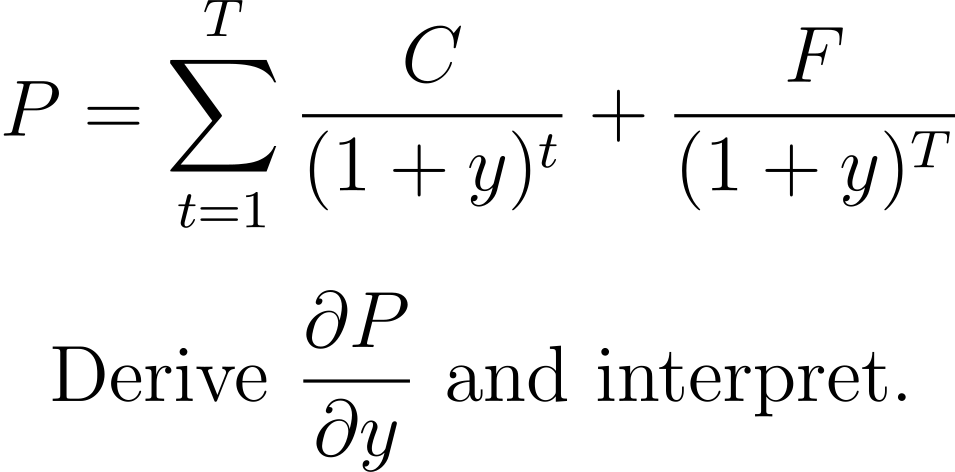
| Solution at the Bottom of this Email 👇 |
| | | Need to study up on topics in math, probability, and finance? 👉 Learn to solve problems like this on Quant Guild — the platform I wish I had when I was studying to become a quant. | | | 📅 Quant Guild Week in Review |
| Hedging Ruins Everything and Rejecting Social Judgement |
|
|
|
|---|
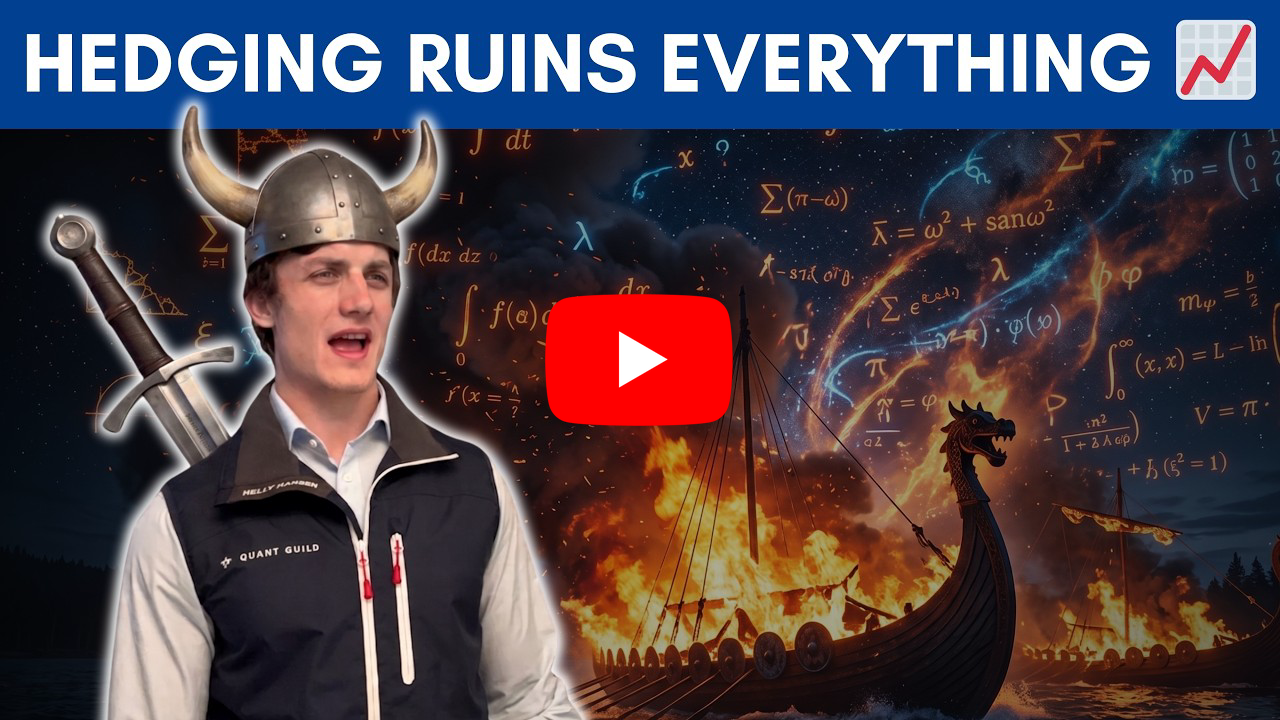
📈 The Math of "Burn the Boats": Why Hedging Ruins Everything | In this video I explain why having a hedge, a backup plan, fundamentally changes outcomes, and I frame it through conditional probability. Any situation can be split into success or failure, but the moment you introduce a hedge, you are conditioning your behavior on the option to retreat. That changes how probability mass is distributed across outcomes. If failure is an option, you do not have to push through during downside variation. When things get difficult, the hedge becomes attractive and you take it. This shifts probability toward failure, not because success is impossible, but because you have given yourself a path to stop trying. In contrast, if there is no hedge, the only way forward is to adapt, persist, and exhaust every possible option. That shifts probability toward success because your behavior changes under constraint. I apply this to real-world scenarios like startups, relationships, and personal decisions. If you have a backup job, you are more likely to abandon the business when things get difficult. If you have a fallback in a relationship, you are less likely to fully commit. The hedge reduces the necessity to make things work, and that alone changes the outcome distribution. The key idea is not motivational, it is structural. Your actions are conditioned on your available choices. When you remove the fallback, you force yourself into a regime where persistence and adaptation are required. The takeaway is simple. Hedging does not just reduce risk. It changes behavior. And in many cases, that change in behavior increases the probability of failure. Here's a link to the full video 👇 | | | 🎲 How to Not Care What People Think with Math | In this video I explain why we care so much about what other people think and how to break out of it using a probabilistic framework. The core idea is that our behavior is driven by how we perceive tail risk. We are biologically wired to overweight rare but extreme negative outcomes, what I call “the tiger.” Even if the probability is tiny, the potential downside is so severe that we act as if it is likely. This same logic carries into social situations. Negative feedback, criticism, or judgment acts like a social version of the tiger. Even if most people are neutral or supportive, a small number of negative responses dominate our perception because we assign them too much weight. That is why a few negative comments can outweigh thousands of silent or positive ones. There is also a second layer, herd behavior. When we see others acting a certain way, we infer there may be hidden risk, like people running from a fire. This pushes us to conform, not because it is optimal, but because we are trying to avoid a perceived tail event. Together, fear of extreme outcomes and social reinforcement keep us aligned with the crowd. The key insight is that this is inconsistent. We willingly take on real, catastrophic risks in daily life, like driving or flying, but avoid much smaller, recoverable risks like pursuing something different or being judged. Once you recognize that mismatch, it becomes easier to detach from social validation. The takeaway is that not caring what people think is not about ignoring others. It is about correctly pricing risk. When you stop overweighting rare negative outcomes and understand why others do, you can make decisions based on your own expected value instead of fear. Here's a link to the full video 👇 | | |
|
|
|---|
|
 | 📈 Why 10,000+ Quants Study on Quant Guild | Quant Guild is the one-stop platform for mastering the math that powers modern finance. With 90+ specialized lessons, adaptive practice with gamified progress that scales with your skill level, real interview questions, courses from A - Z in coding, math, probability & statistics, and exclusive live classes with me, it’s built to take you from fundamentals to the front-office. Everything’s designed for how real quants think and work — focused, practical, and deeply technical. That’s why over 10,000+ students and professionals study on Quant Guild to sharpen their edge and make smarter decisions in the face of uncertainty. | 🏛️ See How Pol Became a Market-Maker with Quant Guild | 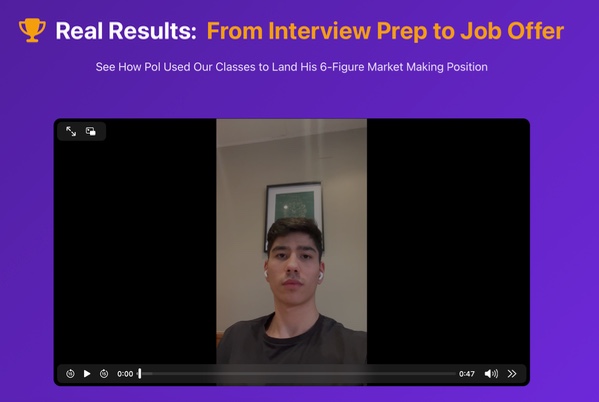 |  |
|
|
|---|
| | I'm in QR preparing for technical interviews and your practice helped me brush up on probability, thanks | | |
| | |
|
| | | I learned more here in two days than an entire semester of college | | |
| - Guy on Discord Who DM'd Me |
|
|
|
|---|
|
| | ✅ Quant Question of the Week |
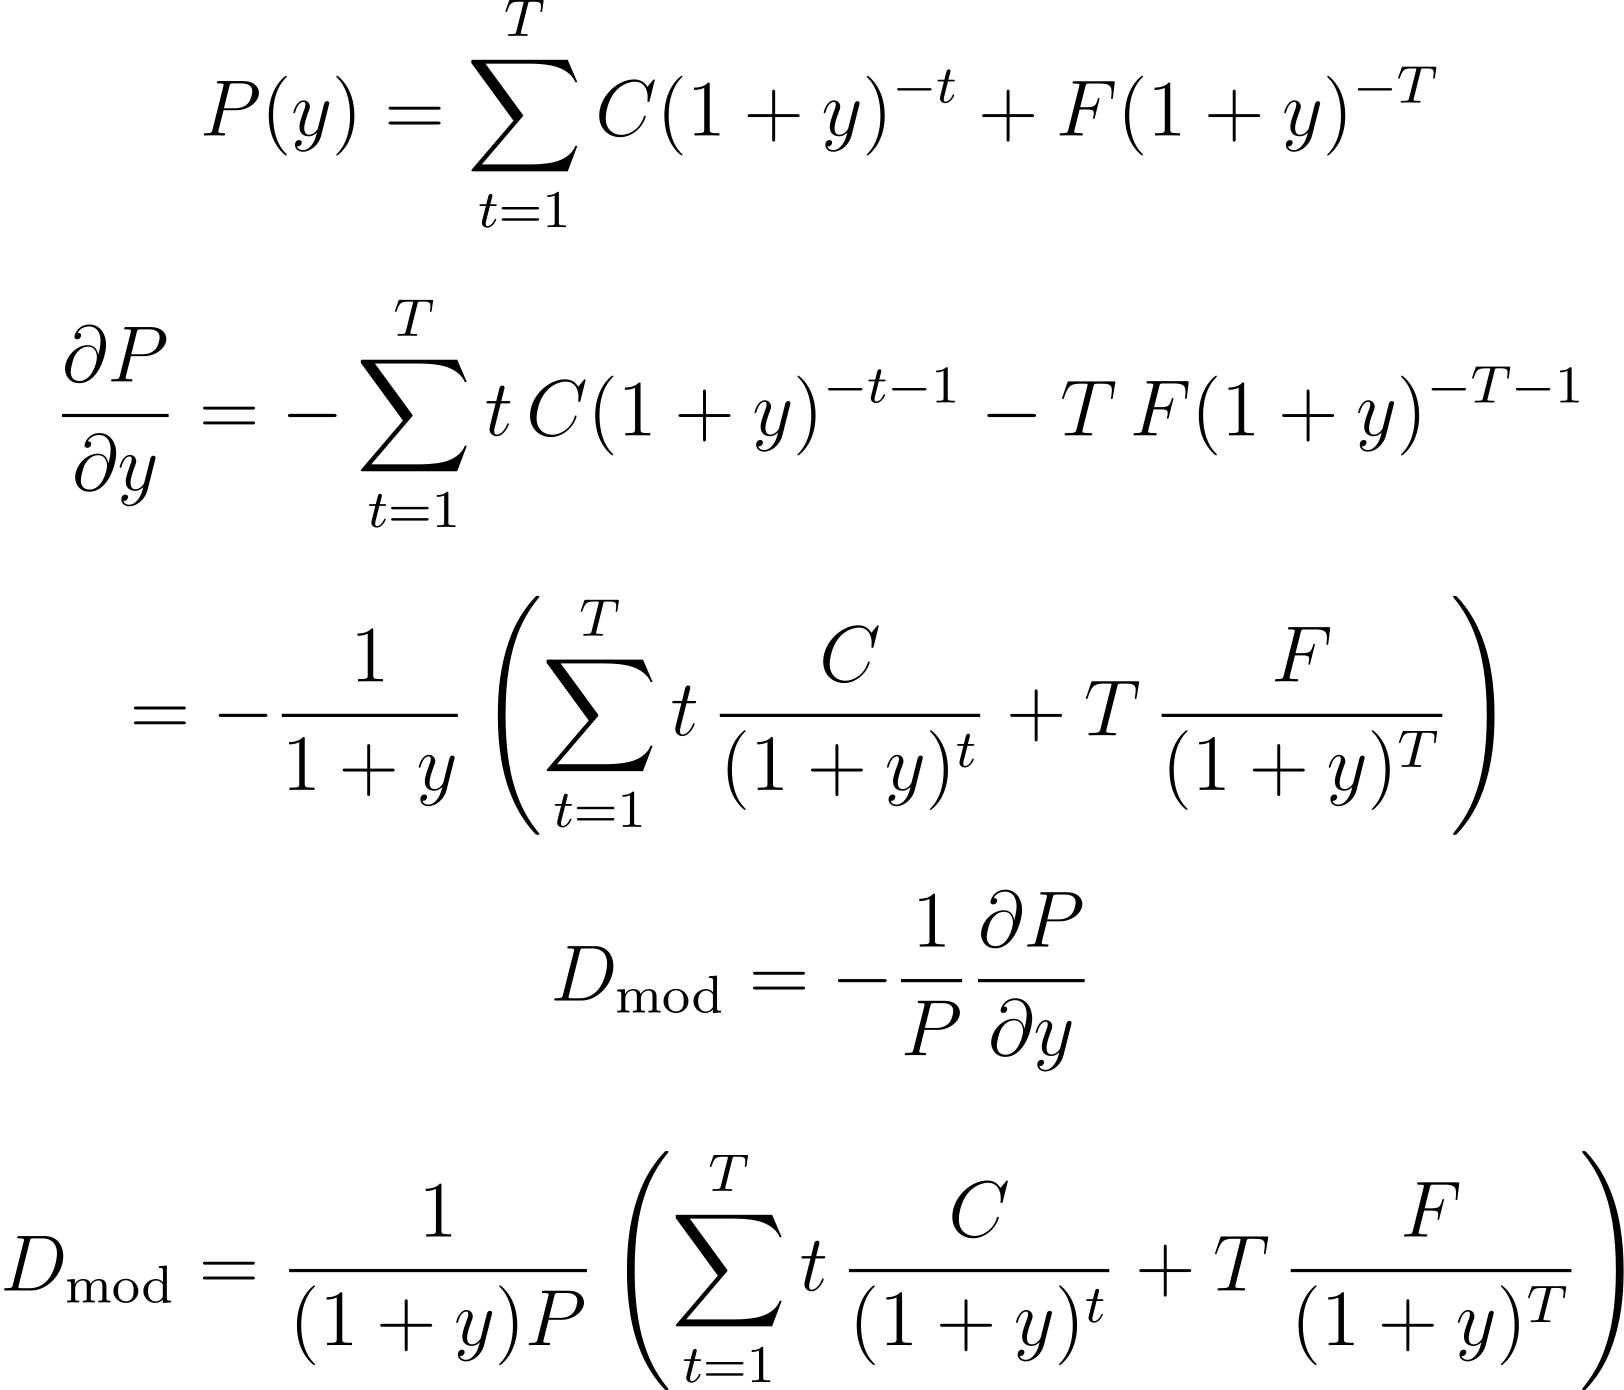
| | | | | Duration is the sensitivity of a bond's price relative to interest rate changes. It is a linear approximation according to the bond's pricing formula and effectively models an expected or anticipated change based on a uniform change in rates. | | |
|
|
|---|
|

 Roman Paolucci