 | | | 📜 A Note from the Guild Leader |
| | | How many individual investors are asleep at the wheel? How many passive managers follow the same buy and hold strategy? The market is a car set to crash, again and again, and almost nobody has insurance. Insurance is overpriced, on average sure (VRP), but only if there isn't a payout. Only if you don't know which insurance is optimal to hold. if you knew your house was going to burn to the ground wouldn't you buy fire insurance? | 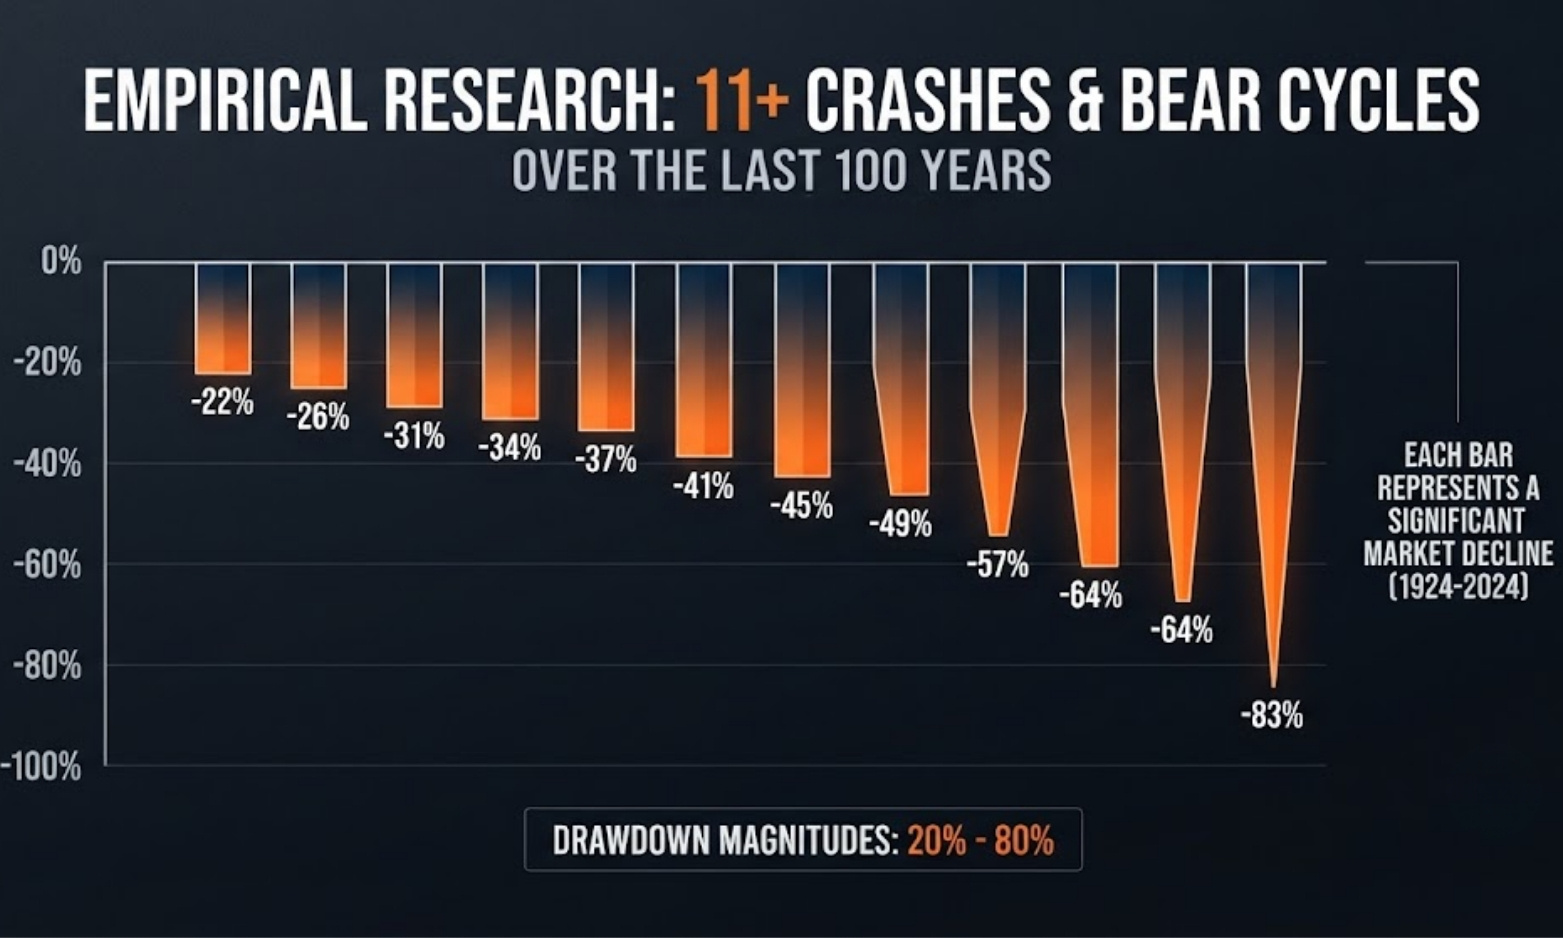 | Sure the graphic above may be illustrative, but see for yourself. How many investors actually look at the time series of S&P 500 returns from the 1920s to today? How many have observed the peak to trough drawdowns between 20% - 80%? Time continues to march on, no crisis is exactly the same, but they certainly echo one another. The real question isn't "will the market crash or go through another bear cycle" it's "what are you going to do when it does". If your strategy generates cash during a drawdown you can buy during the fire sale when others are forced to sell, this is where true wealth creation lies. Positioning and survival: strategy improves CAGR, decreases volatility drag, and forces the geometric compounding of returns faster significantly outperforming buy and hold. This requires active management not passive buy and hold. This is what I teach, sure, but I also practice what I preach for myself and a hand selected circle of LPs... | | | With that I will leave you to the Weekly Guild Letter. I hope you enjoy, and I hope you learn something! - Roman | | |
|
|
|---|
|
📅 Quant Guild Week in Review |
| Failure of Academia, Quant Portfolio Management, Portfolio Alpha & Beta, Improving Sharpe Ratios, Beginner Projects |
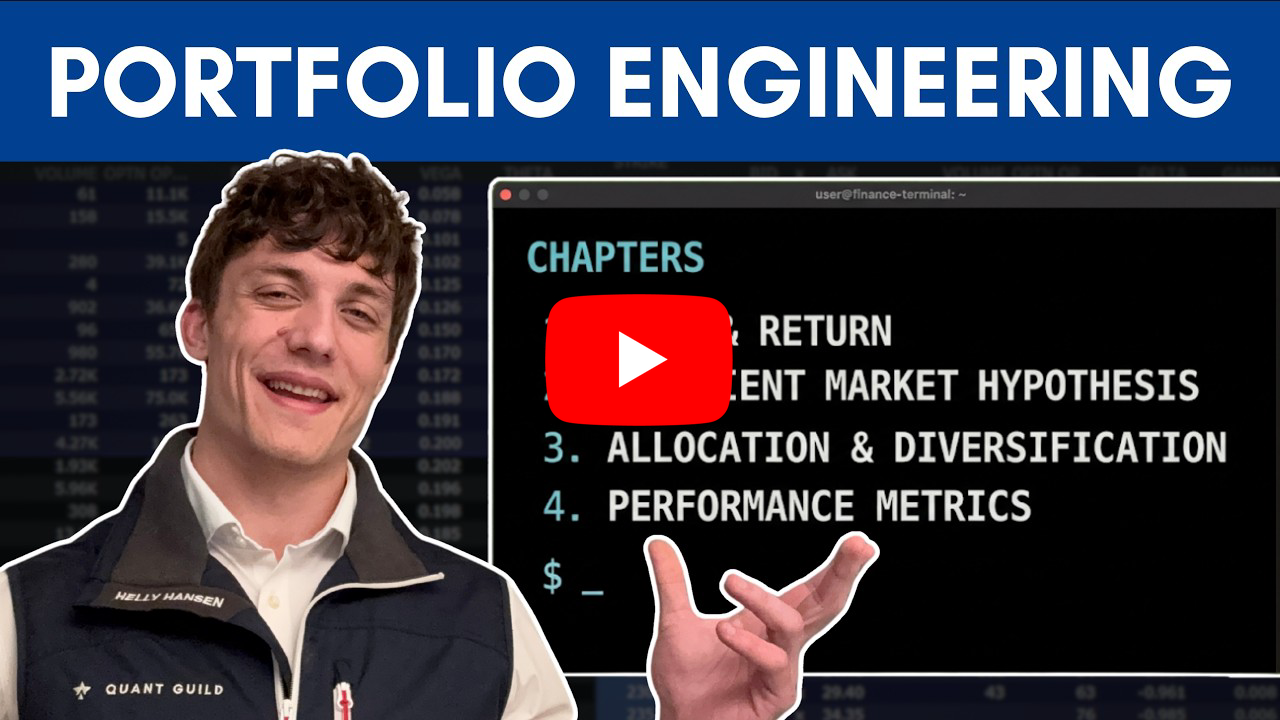
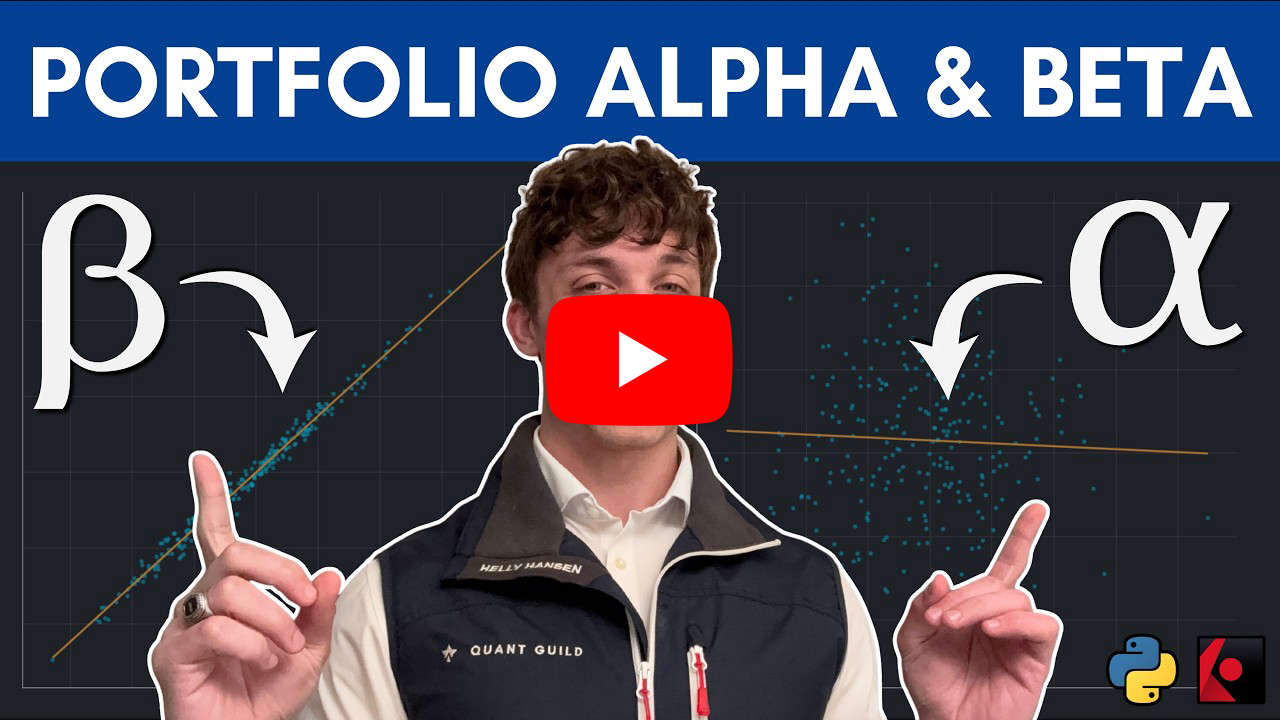
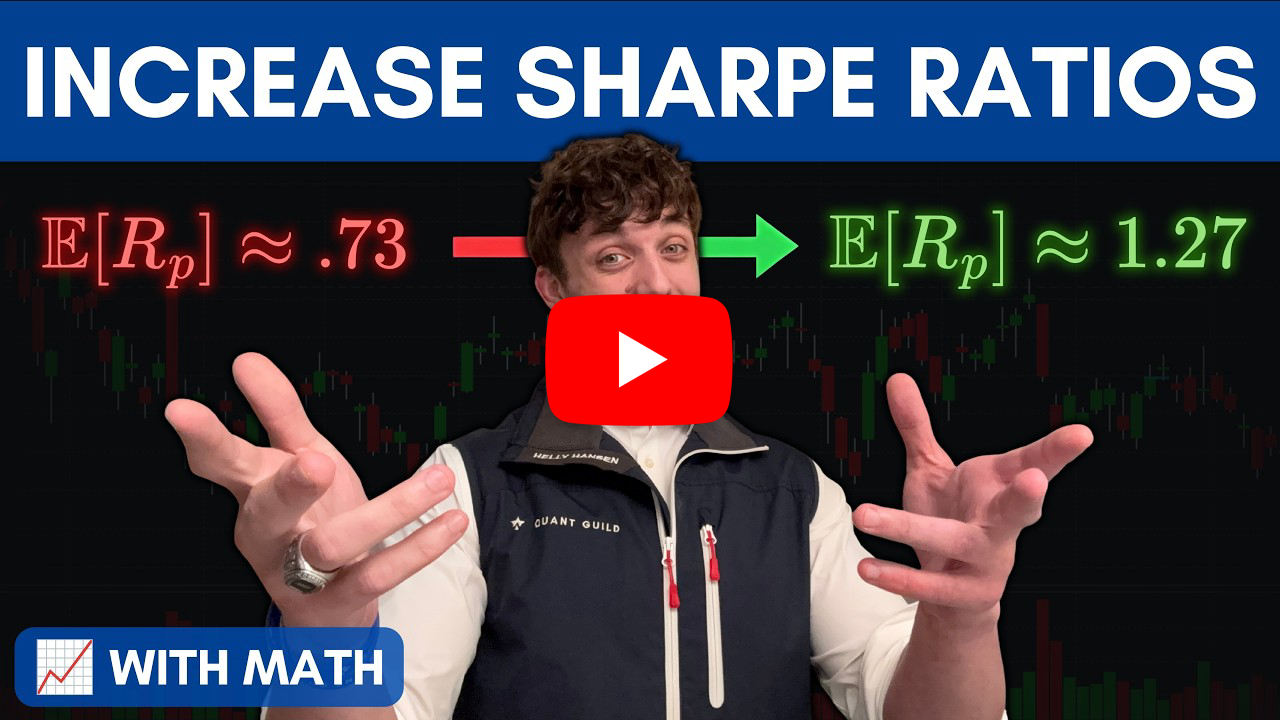
| | | 🏕️ Everyone is Wrong (About Everything All the Time) | In this video I challenge several of the biggest ideas taught in quantitative finance and academia, from the Efficient Market Hypothesis to the definition of alpha itself. Markets are not perfectly efficient, models are not reality, and risk allocation is far more nuanced than many textbooks suggest. I argue that alpha is not simply outperforming a benchmark. It is the result of positioning yourself to capitalize on opportunities when they arise, much like stepping up to the plate and being prepared to hit a home run. The objective is not to be right all the time, but to consistently put yourself in a position where exceptional outcomes are possible. Here's a link to the full video 👇 | | | | | 🎲 The Ultimate Guide to Quant Portfolio Management | In this video I compress nearly everything you need to know about quantitative portfolio management into a single framework. I cover risk and return, diversification, volatility drag, portfolio construction, market efficiency, performance metrics, and the difference between prediction and positioning. The central idea is that investing is not about finding a silver bullet strategy or predicting the future. It is about understanding the risks you are exposed to, constructing portfolios that align with your goals, and surviving long enough for compound growth to work in your favor. Here's a link to the full video 👇 | | | | | 💻 How to Calculate your Portfolio Alpha & Beta | In this video I explain what portfolio alpha and beta actually measure and why understanding the difference is critical for portfolio management. Beta tells us how exposed we are to broader market risk, while alpha measures the portion of returns that cannot be explained by that exposure. I then walk through how to calculate these quantities in practice using Python and the Interactive Brokers API. We automatically pull portfolio holdings, generate historical return series, and compute rolling alpha, beta, and performance metrics relative to a benchmark like SPY. Here's a link to the full video 👇 | | | | | 🧮 Math to Increase your Sharpe Ratios | In this video I derive one of the most important results in portfolio theory: how to mechanically improve your Sharpe ratio. By combining assets with low or negative correlations, you can reduce portfolio variance without necessarily sacrificing expected returns. I walk through the mathematics from first principles and show that diversification is not just an investing cliché. It is a direct consequence of how covariance enters the portfolio variance equation. The lower the correlation between return streams, the greater the potential improvement in risk-adjusted performance. The key distinction, however, is between stochastic and physical independence. Assets that appear uncorrelated today can become highly correlated during periods of market stress. True diversification comes from combining structurally independent sources of return that remain disconnected regardless of market conditions. Here's a link to the full video 👇 | | | | | 🛠️ Projects to Help you Become a Quant (Beginner) | In this video I outline three beginner-friendly projects that I believe provide the strongest foundation for breaking into quantitative finance. Rather than blindly building trading bots or spamming backtests, the goal is to build projects that teach you the underlying mathematics, statistics, and computer science that the industry is built on. I walk through three examples: a quantitative tear sheet for understanding portfolio performance and risk, a grid world search project for mastering algorithms and data structures, and a binomial tree pricer for learning financial derivatives and risk-neutral valuation. Here's a link to the full video 👇 | | |
|
|
|---|
|
| | 🧮 Quant Model of the Week |
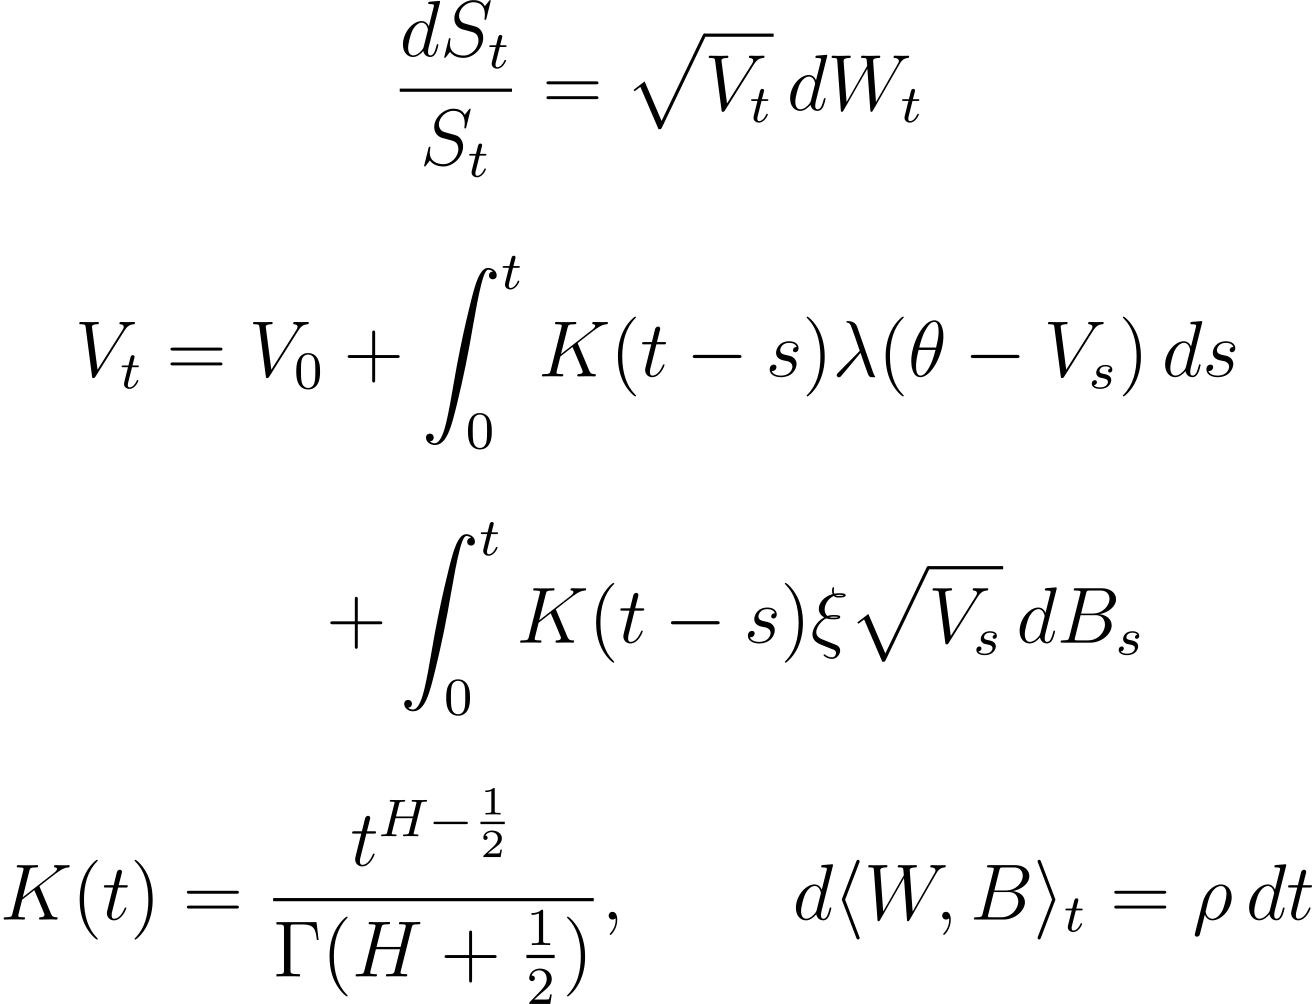
| | | | | Volatility is not just stochastic. It is rough. Classical stochastic volatility models assume volatility evolves smoothly through time, reverting toward a long-run mean with relatively regular dynamics. High-frequency data tells a different story. Volatility is jagged, persistent, and exhibits memory across multiple time scales. The Rough Heston model combines two powerful ideas: the tractability of the Heston framework and the empirical realism of rough volatility. By introducing fractional dynamics into the variance process, it captures both stochastic volatility and the roughness observed in real markets. The result is a model that retains much of Heston's analytical appeal while producing volatility dynamics that look far more like the world we actually trade. | 📚 Model Definition | This following structure is an example of a Markov chain... | | | At a high level, the Rough Heston model combines three ideas: stochastic volatility, mean reversion, and roughness. The asset price, Sₜ, evolves according to the instantaneous variance Vₜ, just as in the classical Heston model. Higher variance produces larger price fluctuations, linking the behavior of the underlying directly to the volatility process. The variance process itself has two components. The first is a mean-reverting term, controlled by λ and θ, which pulls volatility back toward a long-run level. The second is a stochastic shock term, scaled by ξ, which introduces randomness into the evolution of volatility. The key difference is the kernel K(t). Rather than allowing volatility to evolve with smooth, Markovian dynamics, the power-law kernel introduces memory through the Hurst parameter H. When H is small, volatility becomes rough, exhibiting the jagged, persistent behavior observed in empirical data. Finally, the Brownian motions W and B are correlated through ρ, generating the familiar leverage effect where falling prices tend to coincide with rising volatility. Effectively, the Rough Heston takes the classical Heston framework and replaces smooth volatility dynamics with a fractional, memory-driven process. The result is a model that captures both stochastic volatility and the roughness that real markets appear to exhibit. | 📈 Model Applications | In practice, Rough Heston is used for pricing and hedging derivatives in markets where volatility exhibits both stochastic behavior and rough dynamics. It is particularly valuable for equity and index options, where classical models often struggle to reproduce the short-maturity volatility smile. By incorporating memory through the rough kernel, Rough Heston produces implied volatility surfaces that align much more closely with observed market data. The model is also used in Monte Carlo simulation, volatility surface construction, and model calibration. Institutions can fit the parameters to option prices and use the resulting dynamics for pricing exotic derivatives and managing volatility risk. Of course, this realism comes at a cost. Rough Heston is significantly more computationally demanding than its classical counterpart, and calibration can be challenging. But that tradeoff is common in quantitative finance: better empirical fit often means greater mathematical and computational complexity. Ultimately, Rough Heston represents a shift in philosophy. Instead of assuming volatility is smooth because it is convenient, it attempts to model volatility as it appears to behave in reality—rough, persistent, and far from memoryless. | 🎓 A Little Story | The first time I learned about long memory processes, I thought they were straight up fucking cool. Seriously. You spend years being told that everything is Markovian. The future depends on the present. Memoryless dynamics. Nice, clean mathematics. And then someone comes along and says, "Actually, what if the process remembers?" That completely broke my brain. The idea that events from the distant past could still influence the present through a power-law decay felt less like mathematics and more like science fiction. And the craziest part was that the empirical evidence suggested markets might actually behave this way. I remember going down an absolute rabbit hole: fractional Brownian motion, rough volatility, Hurst exponents, power-law kernels. Every paper I read made me more convinced that this was one of the coolest ideas in quantitative finance. Whether rough volatility is the final answer is almost beside the point. The first time you realize that stochastic processes do not have to forget, you start looking at randomness very differently. | 💡 Takeaway | Rough Heston is a reminder that markets are often more complicated than our models would like them to be. Classical volatility models assume smoothness because it is mathematically convenient. Rough Heston asks what happens if we instead model volatility as it appears to behave: irregular, persistent, and influenced by the distant past. Whether rough volatility is the final word remains an open question. But the broader lesson is an important one: sometimes the path to better models is not adding more parameters, but relaxing the assumptions we have taken for granted. After all, if volatility remembers, perhaps our models should too. | | | 🏆 Quant Question of the Week |
| Solution at the Bottom of this Email 👇 |
| | | | | Need to study up on topics in math, probability, and finance? 👉 Learn to solve problems like this on Quant Guild — the platform I wish I had when I was studying to become a quant. |
|
|
|---|
| | I'm in QR preparing for technical interviews and your practice helped me brush up on probability, thanks | | |
| | |
|
| | | I learned more here in two days than an entire semester of college | | |
| - Guy on Discord Who DM'd Me |
|
|
|
|---|
|
| | ✅ Quant Question of the Week |
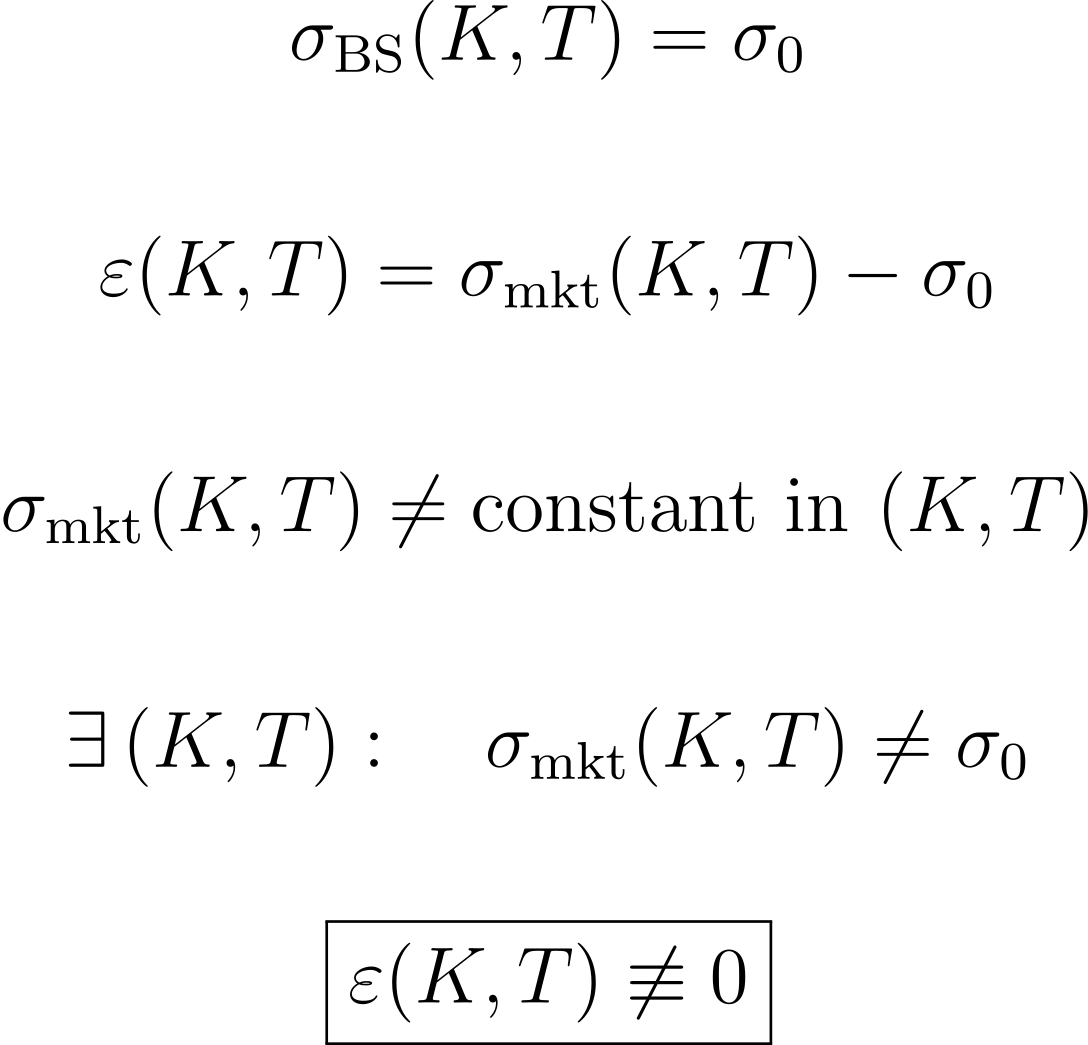
| | | | | The Black-Scholes model enables us to produce market implied volatilities, but it is incapable of calibrating to the volatility surface for each option on the grid simultaneously as the underlying process assumes constant volatility. | | | | |
|
|
|---|
|

 Roman Paolucci